
FIG. 4.
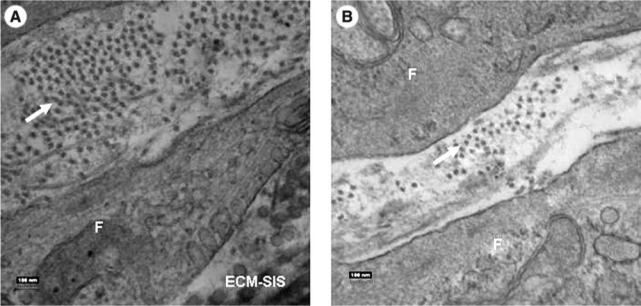
Transmission electron microscopy of ECM-SIS after cell seeding. (A) Newly produced collagen in group I as indicated by the arrow; (B) Newly produced collagen in group II as indicated by the arrow. Magnification at 70,000. “F” indicates fibroblast.