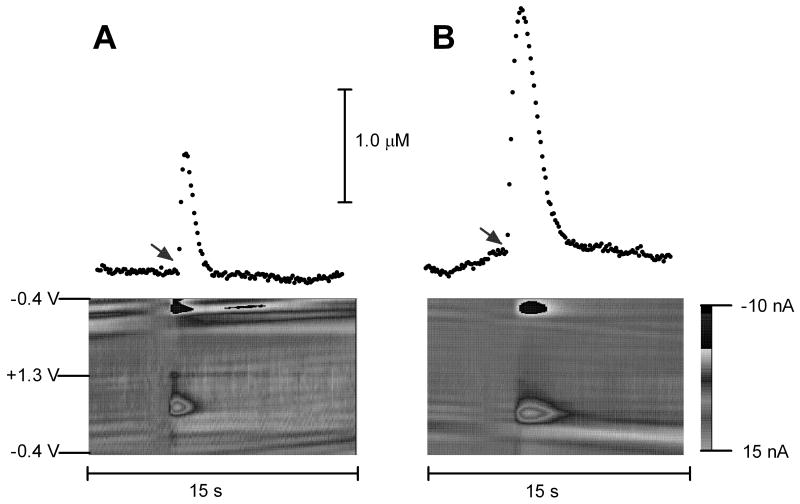
Figure 1.
(top) Representative concentration-time plots of electrically evoked dopamine measured in the dorsal striatum before (left) and 10 minutes after (right) a single injection of cocaine (15 mg/kg i.p.). Arrows indicate the onset of electrical stimulation.(bottom) Representative color plots – which topographically depict the voltammetric data with time on the x-axis, applied scan potential on the y-axis and background-subtracted faradaic current shown on the z-axis in pseudo-color – are illustrated before (left) and after (right) cocaine administration.

