Fig. 2.
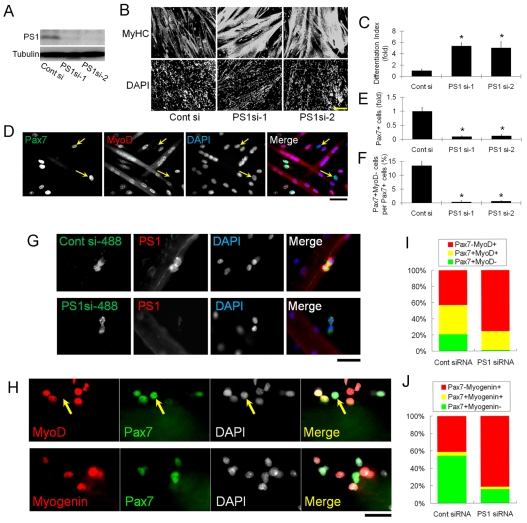
PS1 is required for satellite cell self-renewal and maintenance of progenitor cells. To examine the effects of PS1 on satellite cell myogenic progression, we first knocked-down PS1 protein levels using siRNA. (A) Both PS1 siRNAs (PS1si-1 and PS1si-2) efficiently knockdown PS1 protein in plated primary satellite-cell-derived myoblasts as shown by western blotting. (B) Satellite-cell-derived myoblasts were cultured for 3 days after siRNA transfection and then immunostained for MyHC. A dramatic increase in the extent of myogenic differentiation and formation of myotubes was observed with both siRNA species directed against PS1 as compared to controls (Cont si). (C) Differentiation index quantifying the increased myogenic differentiation caused by PS1 knockdown, calculated as fold change in the number of DAPI-stained nuclei in MyHC+ cells, divided by the total number of DAPI-stained nuclei. (D) Immunocytochemistry of plated primary myoblasts was also used to investigate the presence of cells with a self-renewal phenotype (Pax7+MyoD–) 3 days after siRNA transfection (arrows indicate Pax7+MyoD– cells), and clearly demonstrate that reduced PS1 levels resulted in less Pax7+ cells (quantified in E) and self-renewal (quantified in F). (G) AlexaFluor488-conjugated control siRNA and PS1 siRNA duplexes were transfected into satellite cells retained in their niche on isolated myofibres, and knockdown of PS1 protein confirmed by immunocytochemistry 48 hours later. (H) The effects of PS1 knockdown on satellite cell fate were examined by immunostaining for Pax7, MyoD (arrows indicates Pax7+MyoD– cell) and Myog 72 hours after PS1si-1 transfection. (I,J) PS1 knockdown reduced the percentage of satellite-cell-derived myoblasts exhibiting the self-renewal phenotype (Pax7+MyoD–), while increasing the percentage of cells committed to differentiation (Pax7–MyoD+ and Pax7–Myog+). Data from at least three independent experiments is shown ± s.d. Asterisks in C, E and F indicate that data are significantly different from control values (P<0.05). Scale bars: 100 μm (B), 30 μm (D,G,H).

