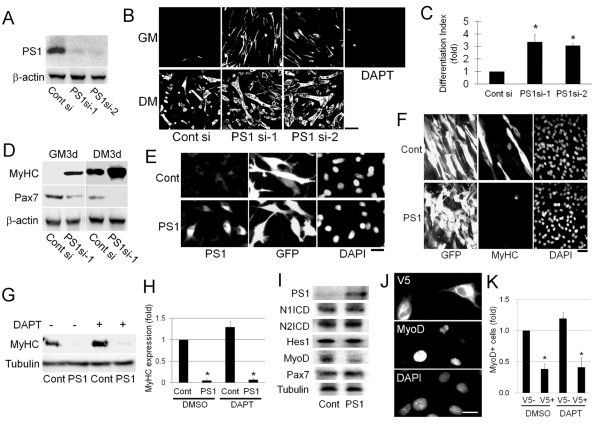
Fig. 4.
PS1 negatively regulates MyoD expression in a γ-secretase-independent mechanism. In order to obtain sufficient material for biochemical analysis, we also used the adult mouse muscle-derived C2C12 myogenic cell line. (A) Immunoblot analysis showed that proliferating C2C12 cells expressed PS1, and that the siRNA-targeting PS1 (PS1si-1 and PS1si-2) was effective at reducing PS1 protein levels. (B) As with primary myoblasts, exposure of C2C12 myoblasts to siRNA against PS1 promoted myogenic differentiation, as shown by immunostaining for MyHC, in both growth (GM) and differentiation medium (DM) (quantified in C for DM). Importantly, treatment with DAPT in GM for 3 days to inhibit γ-secretase activity did not reproduce the effects of PS1 knockdown, being unable to induce expression of MyHC in C2C12 cells. (D) Immunblot analysis of siRNA-transfected C2C12 cells cultured in GM or DM for 3 days after transfection confirmed increased MyHC expression. Importantly, Pax7 levels were significantly reduced by PS1 knockdown under both culture conditions. (E-I) PS1 was also constitutively expressed in C2C12 myoblasts by transient transfection with PS1-expression vector (pMSCV-PS1-IRES-GFP). (F) Immunocytochemical analysis for MyHC revealed that myogenic differentiation was again inhibited. (G) Immunoblot analysis of transfected C2C12 cells constitutively expressing PS1, illustrating that inhibiting γ-secretase activity by exposure to 1 μM DAPT for 2.5 days did not alter the marked reduction in MyHC levels (quantified in H). (I) Immunoblot analysis demonstrated that constitutive PS1 expression in C2C12 cells cultured in GM for 24 hours after transfection did not affect the levels of Notch1 ICD, Notch2 ICD or Hes1, but that MyoD was significantly reduced, compared to the tubulin protein loading control. (J) Similar results were obtained using a V5-tagged PS1 expression vector transfected into C2C12 cells. Immunostaining showed that MyoD expression was reduced to a similar degree, with or without exposure to 1 μM DAPT to inhibit γ-secretase activity (quantified in K). Data from at least three independent experiments is shown ± s.d. Asterisks in C, H and K indicate that data are significantly different from control values (P<0.05). Scale bars: 100 μm (B), 20 μm (E), 30 μm (F) and 10 μm (J).

