
Fig. 2.
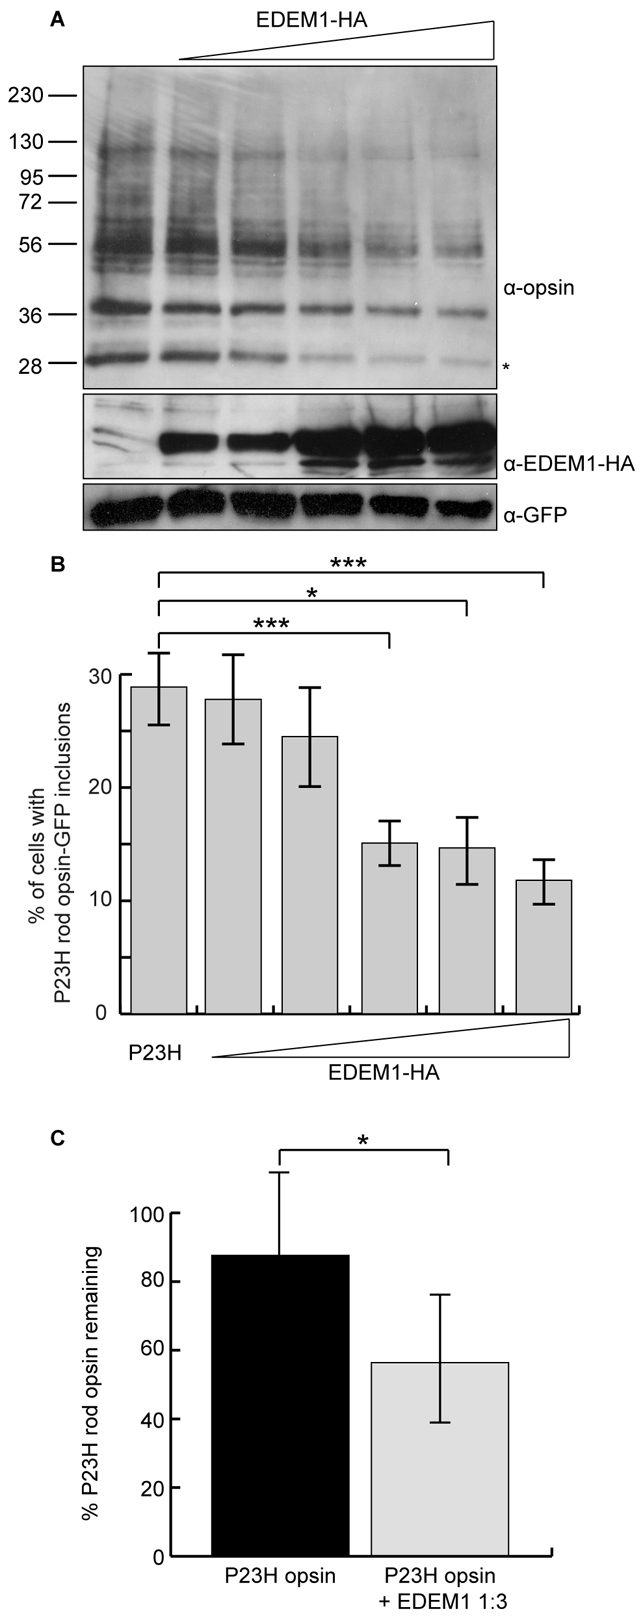
EDEM1 accelerates the degradation of mutant rod opsin. (A) Constant amounts of P23H rod opsin-pMT3 and increasing (1:0.5, 1:1, 1:2, 1:3, 1:4) ratios of EDEM1-HA plasmid were transfected in SK-N-SH cells. DM-soluble fractions were obtained 24 hours after transfection and 10 μg protein resolved by SDS-PAGE. Proteins were immunoblotted with antibodies against opsin, HA and GFP, as indicated. GFP was used as a transfection and loading control. The position of molecular mass markers in kDa are indicated on the left. Asterisk indicates the species most sensitive to EDEM1-enhanced degradation. (B) The incidence of inclusion formation for P23H rod opsin-GFP was assessed in SK-N-SH cells with increasing (1:0.5, 1:1, 1:2, 1:3, 1:4) ratios of EDEM1-HA plasmid. Error bars represent ± 2 s.e.m. ***P<0.001, *P<0.05. P23H 1:4 EDEM1, ***P=0.0009. P23H 1:3 EDEM1, *P=0.012. P23H 1:2 EDEM1, ***P=0.0005. (C) SK-N-SH cells were pulsed for 20 minutes with [35S]methionine/cysteine and were chased in unlabelled methionine for 60 minutes. P23H rod opsin 1D4 immunoprecipitates were digested with 1500 units PNGaseF overnight and resolved by SDS-PAGE. Quantification of deglycoslyated P23H rod opsin was performed using ImageJ from four replicates. Error bars represent ± 2 s.e.m. *P<0.05.