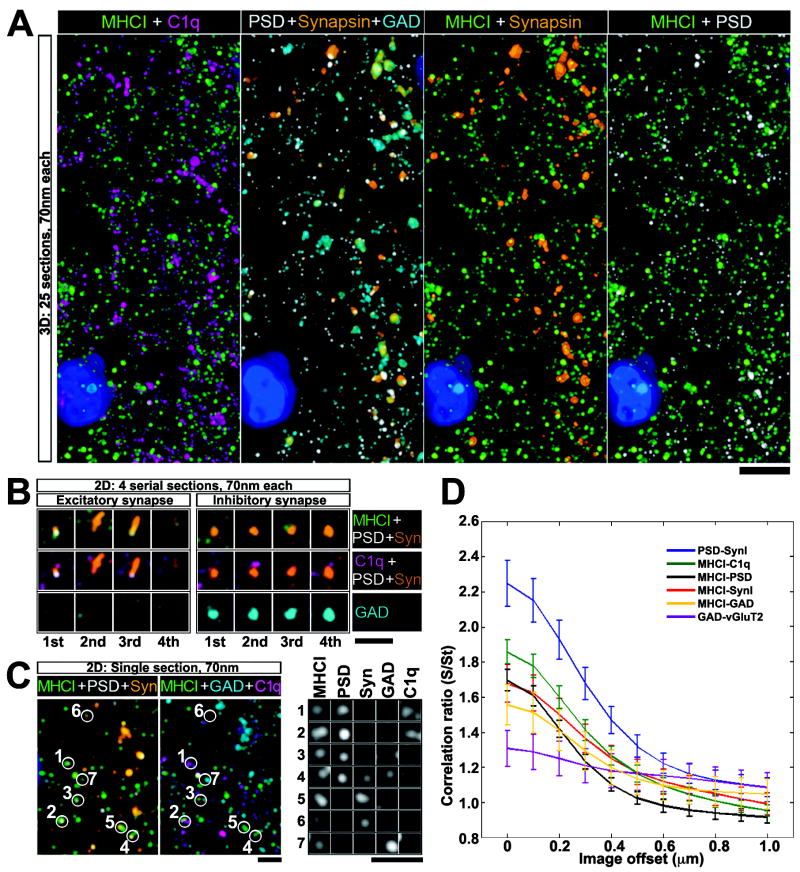
Figure 4. MHCI localization in relation to synaptic proteins during period of retinogeniculate refinement.
(A) AT micrographs reconstructed from 25 serial ultrathin sections (each 70nm thick) of P7 LGN showing MHCI immunostaining (green) in relation to known synaptic markers (Syn=synapsin (orange), PSD=postsynaptic density-95 (white), GAD=glutamic acid decarboxylase 65/67 (cyan)), as well as to C1q=complement protein C1q (magenta). DAPI stain of nuclei, blue. Scale = 5μm. (B) Four serial sections of 2 different synapsin positive puncta: Left example is characteristic of an excitatory synapse (close apposition of presynaptic marker synapsin with postsynaptic excitatory synapse marker PSD-95); Right example is characteristic of an inhibitory synapse (overlap of synapsin with GAD and absence of PSD-95). MHCI and C1q are closely associated with both types of synapses. (C) Single ultrathin section, showing colocalization between MHCI puncta and PSD, Synapsin, GAD and C1q. Bottom right, zoomed in view of puncta numbered on left, showing immunofluoresence signal in separate channels, Scale = 2μm. Note colocalization of signal for MHCI, PSD and C1q at puncta #1 and 2. (D) Cross correlations showing pairwise comparisons of degree of spatial overlap between puncta immunostained for the various markers (Experimental procedures and Figure S4 online). Synapsin vs. PSD95 shows strongest correlation, and GAD vs. vGluT2 the weakest. MHCI is more correlated with C1q than with other markers. Si/St = Cr, the correlation ratio between two channels as a multiple of their baseline correlation. Cr = 1 indicates no correlation, Cr ≫ 1 indicates high correlation, Cr < 1 indicates negative correlation.

