Figure 1.

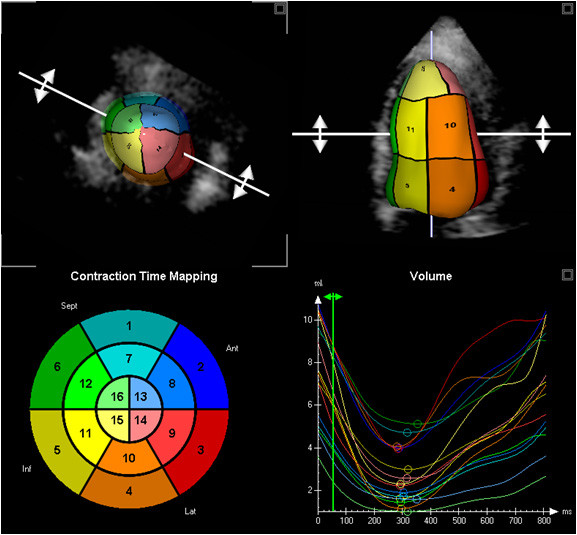
Regional 3DE measurement; 16 segment model (bottom left) with corresponding LV shape (top images) and time volume curves of all 16 segments (bottom right).

Regional 3DE measurement; 16 segment model (bottom left) with corresponding LV shape (top images) and time volume curves of all 16 segments (bottom right).