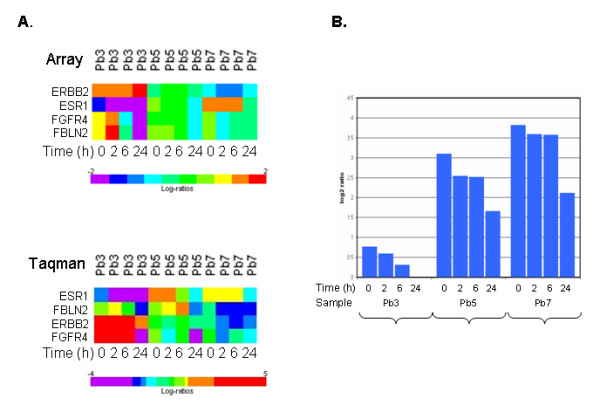
Figure 5.

Expression of selected genes as a function of time. Panel A. Time course of ESR1, FBLN2, FGFR4 and ERBB2 expression for the three specimens (Pb3, Pb5 and Pb7). ESR1, FBLN2, FGFR4 are significantly down-modulated both in microarray and qPCR data. Panel B. Time course of ESRI microarray expression data for three samples with different basal ESR1 levels.
