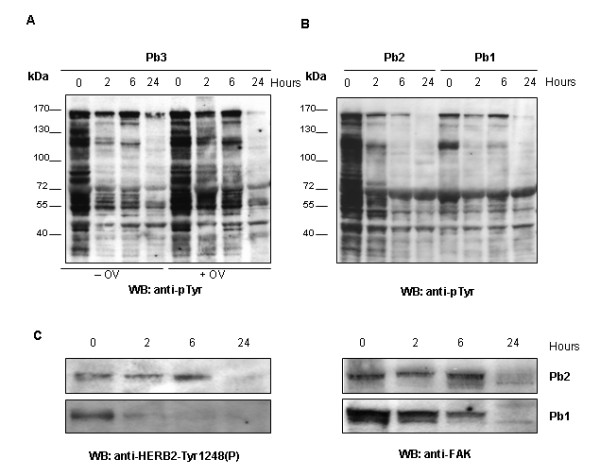
Figure 6.

Phosphotyrosine profiles as a function of freezing time. Time course analysis (0, 2, 6 and 24 hours) of tyrosine phosphoproteins of three breast cancers. A. Anti-p-Tyr immunoblot on equal amounts of extracts from sample 1 lysed in absence or presence of Orthovanadate (OV); B. Anti-p-Tyr immunoblot on equal amounts of extracts from sample 2 and 3 lysed in presence of Orthovanadate; C. Anti-HERB2-Tyr1248(P) and anti-FAK immunoblots of equal amounts of extracts from sample 2 and 3.
