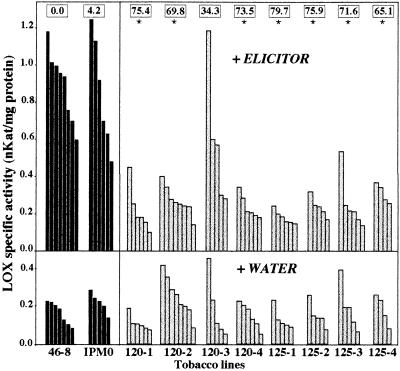
Figure 2.
Measurements of LOX activity in AS-LOX (gray bars) and control (black bars) tobacco plants whose roots were allowed to absorb either elicitor or water (Upper and Lower, respectively). Each bar represents the LOX activity of an individual plant. Tobacco lines correspond to: 46-8, WT control; IPM0, transgenic 46-8 line bearing the LOX-free T-DNA; 120-1 to -4 and 125-1 to -4, transgenic 46-8 AS-LOX plants. Boxes along the top of the graph indicate the average reduction (%) of LOX activity of each line upon elicitation, as compared with the WT 46-8 control. Significance was determined by repeated-measures ANOVA and Tukey’s HSD test. ∗, Significant difference from the controls, P < 0.001.

