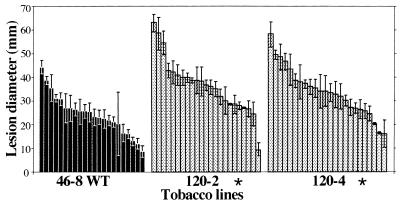
Figure 6.
Infection of control and transgenic AS-LOX lines by Rhizoctonia solani. Plants were inoculated on the leaf surface. Eight pads per plant were distributed on four different leaves. Four days postinoculation, the average lesion diameter was determined for each plant. Each bar represents the mean lesion size on a plant ± SEM. Significance was determined by repeated-measures ANOVA and Tukey’s HSD test. ∗, Significant difference from the WT 46-8 line at P < 0.001.

