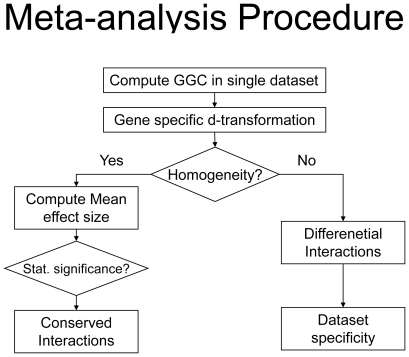
Figure 1. Proposed meta-analysis algorithm flowchart.
After calculating all pair-wise gene-gene correlation coefficients (GGC) and transforming them into the proposed d-statistic, the algorithm iterates through every gene-pair one at a time, testing for homogeneity and whether the mean effect size differs significantly from zero.

