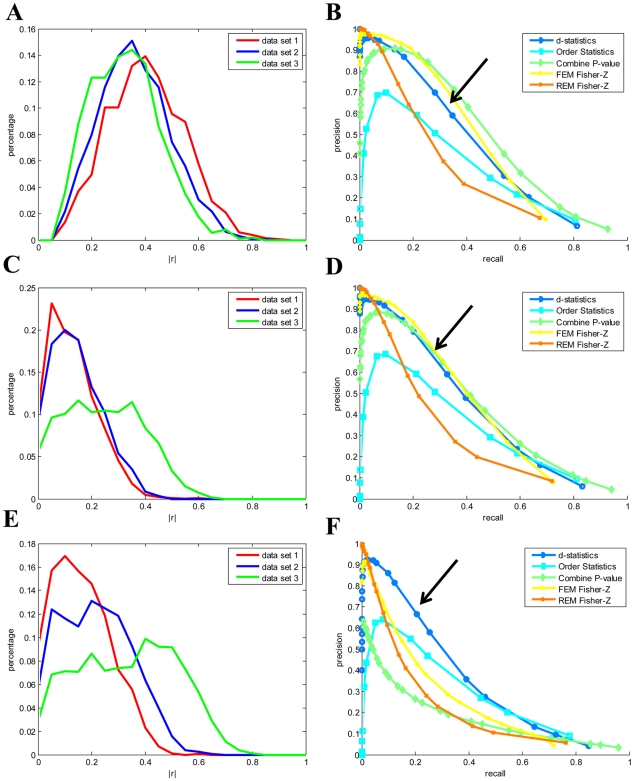
Figure 2. Performance comparison of different meta-analysis methods under different noise conditions.
(A) the signal strengths (measured by the correlation between the latent regulators and their downstream genes); (B) the performances of different methods when there was no systematic noise; (C) moderate systematic noises (measured by the correlation between genes and systematic noises); (D) the performances of different methods when the systematic noises were as shown in (C); (E) stronger systematic noises than (C); (F) the performances of different methods when the systematic noises were as shown in (E). FEM Fisher-Z: the fixed effect model based on Fisher-Z transformation; REM Fisher-Z: the random effect model based on Fisher-Z transformation; Combine P-value: combine p-values of Fisher's Inverse  tests; Order Statistic: Order-based non-parametric meta-analysis; d-statistics: the semi-parametric meta-analysis. See Materials and Methods section for details of individual methods.

