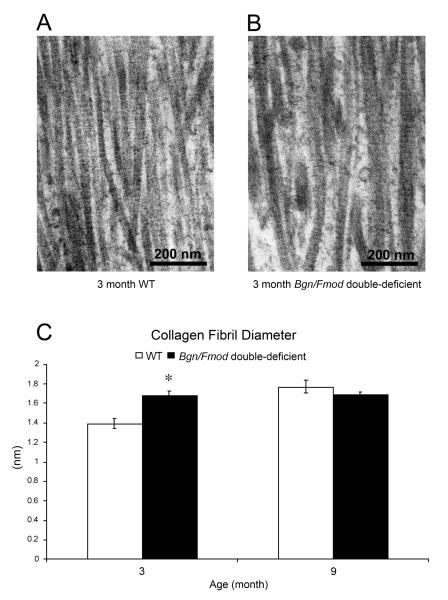
Figure 3.
Transmission Electron Microscopy (TEM) analysis of the condylar cartilage. TEM images of (A) 3 month WT and (B) 3 month Bgn/Fmod double-deficient mice. (C) A graphic representation of the data comparing 3 month WT and Bgn/Fmod double-deficient mice versus the 9 month WT and Bgn/Fmod double-deficient mice. Analysis was conducted at two time points for a total of 26 mice: 3 months, WT (n = 6) and Bgn/Fmod double-deficient (n = 6), and 9 months, WT (n = 6) and Bgn/Fmod double-deficient (n = 8). Asterisk (*) denotes a statistically significant difference between WT and Bgn/Fmod double-deficient mice (p< 0.05). WT = wild-type; Bgn = biglycan; and Fmod = fibromodulin.

