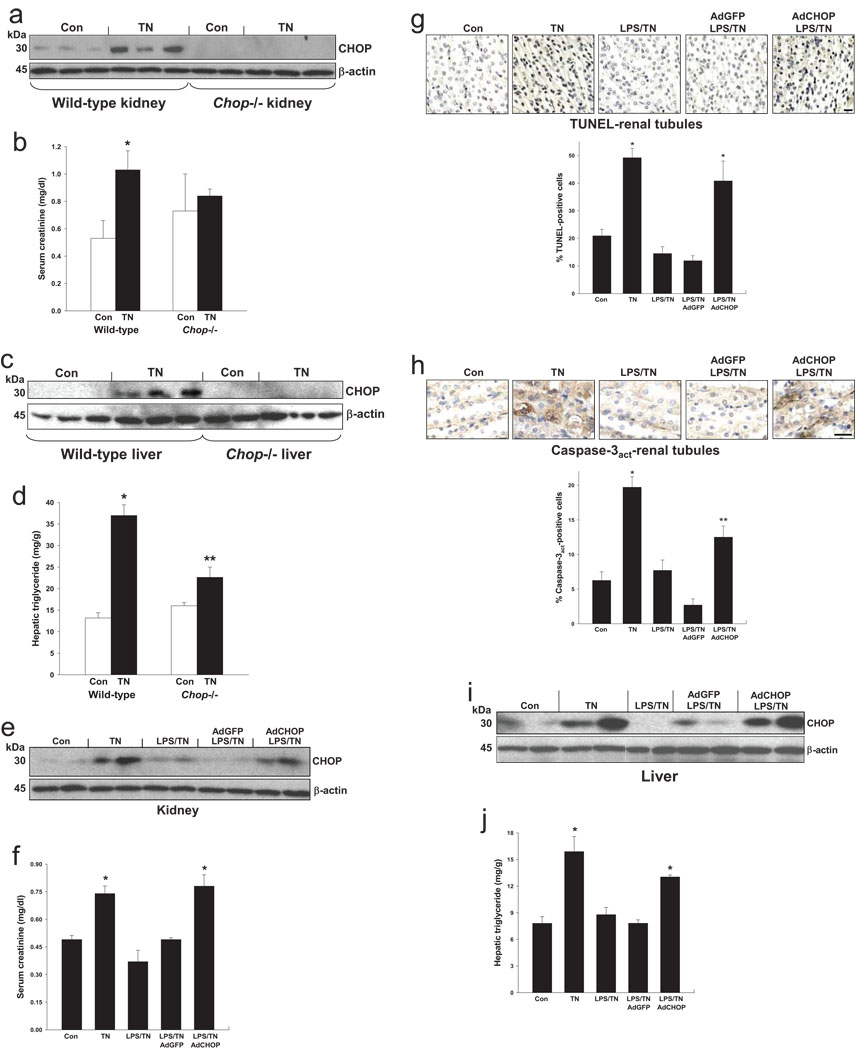
Figure 5.
Protection from tunicamycin-induced renal dysfunction and hepatosteatosis by pre-treatment with low-dose LPS is due to suppression of CHOP. (a–d) Wild-type or Chop−/− mice were injected with 1 mg/kg tunicamycin (TN) intraperitoneally and sacrificed 48 h later. In (a–b), kidneys were collected and subjected to immunoblot for CHOP and β-actin, and serum was assayed for creatinine concentration. *, P<0.01 vs. Con; the two values for the Chop−/− mice were not statistically different. In (c–d), livers were collected and subjected to immunoblot for CHOP and β-actin, and extracts were assayed for triglyceride mass. *, P<0.001 vs. Con; **, P<0.01 vs. wild-type TN value. (e-j) Mice were injected i.v. with 80 µg/kg LPS or vehicle control intravenously for 2 consecutive days. On the second day, some mice were injected i.v. with either GFP-expressing adenovirus (AdGFP) or with CHOP-expressing adenovirus (AdCHOP). Mice were then injected with 1 mg/kg tunicamycin (TN) intraperitoneally and sacrificed 48 h later. In (e–f), expression of renal CHOP and serum creatinine levels were determined. *, P<0.01 vs. Con and AdGFP. In (g–h), renal tubule sections were stained for TUNEL or activated caspase-3 and quantified for percent-positive cells. *, P<0.001 vs. Con; **, P=0.01 vs. control and <0.001 vs. AdGFP. In (i–j), liver extracts were assayed for CHOP expression and triglyceride mass. *, P<0.01 vs. Con and AdGFP.

