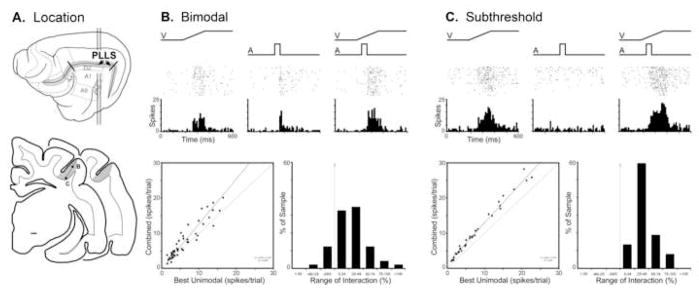
Figure 3. Auditory influences on visual activity in the posterolateral lateral suprasylvian visual area (PLLS).
Part ‘A’ illustrates, on the lateral view of the cat cerebral cortex, the location of the PLLS, as well as its position (shaded gray on coronal sections) within the lateral bank of the suprasylvian sulcus. The line/black dot represent the recording penetration and site (respectively) of a bimodal (B) and a subthreshold multisensory (C) neuron whose activity is depicted in subsequent parts. Part ‘B’ shows the activity (raster of an PLLS bimodal neuron to a visual (ramp labeled ‘V’), auditory (square wave labeled ‘A’) and combined visual-auditory stimulation. The scatter plot in ‘B’ shows, for the population of bimodal neurons, the relationship of activity elicited by visual stimulation alone (x-axis) versus that evoked by the combined visual-auditory stimuli (y-axis). The large majority of bimodal neurons exhibited combined responses that plotted above the line of unity and, although the magnitude of these responses was generally small (B: bar graph) several responses were near or exceeded 100%. Part ‘C’ shows the excitatory response of an PLLS subthreshold multisensory neuron to a visual, but no response to an auditory stimulus. However, when the stimuli were combined, the resulting response was significantly (p<0.05, paired t-test) greater than that elicited by the visual stimulus alone. The scatter plot in ‘C’ for the population of PLLS subthreshold multisensory neurons shows the relationship of activity elicited by visual stimulation alone (x-axis) versus that evoked by the combined visual-auditory stimuli (y-axis): all plotted above the line of unity but the magnitude of these responses was generally small (<±50%; C: bar graph).

