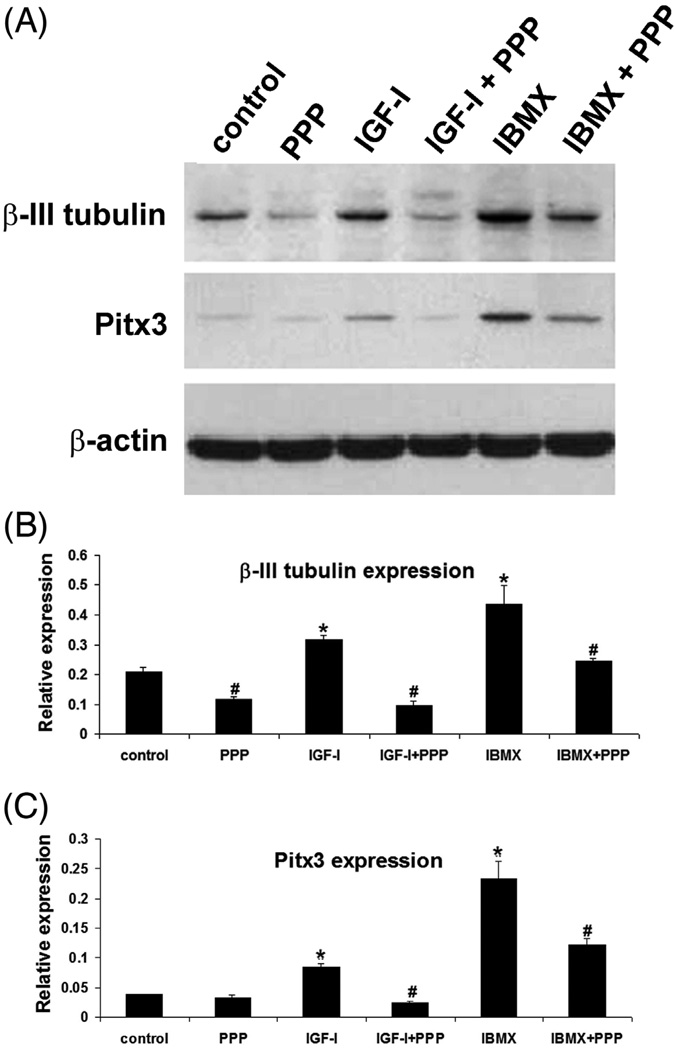
Figure 1. IGF and IBMX upregulate β-III-tubulin and Pitx3 expression.
ADSC were treated with the indicated reagents at top and then analyzed by western blotting for β-III-tubulin and Pitx3 expression, with β-actin serving as control. The experiment was repeated 3 times and each protein band analyzed by densitometry. Statistical analysis of the densitometric data is shown in panels B and C. “Relative expression” denotes ratio of β-III-tubulin or Pitx3 expression versus β-actin expression. * indicates significant difference (P <0.05) when compared to control. # indicates significant difference (P <0.05) when compared to corresponding treatment without PPP.

