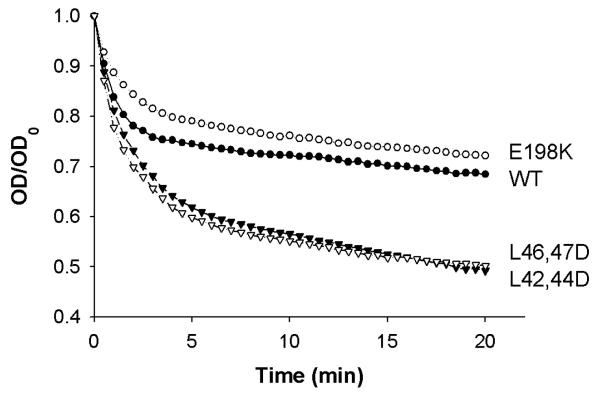
Figure 3.
Representative Curves from Liposome Clearance Assay. WT apoA-I (•), apoA-I E198K (○), apoA-I L42,44D (▼), and apoA-I L46,47D (▽). The experiment was performed as described in Materials and Methods. All points are the mean of three replicates. The fractional absorbance was calculated as optical density (OD) divided by the initial optical density (OD0). A rate constant, k (min-1), was calculated for each mutant by fitting the fractional absorbance at 325 nm vs time to a monoexponential decay equation for the first 5 min of the reaction using Microsoft Excel. (See Table 2)

