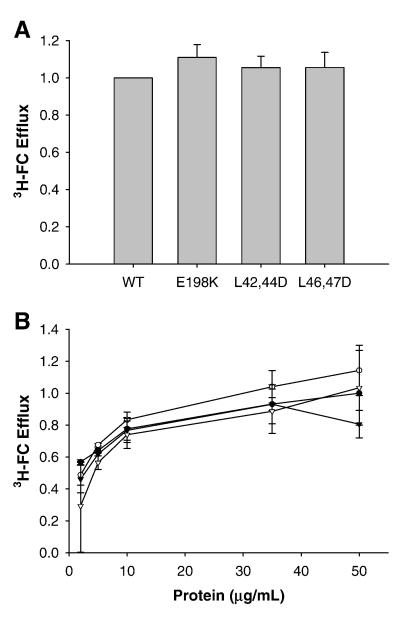
Figure 4.
Efflux of cholesterol to lipid-free apoA-I mutants. As described in Materials and Methods, RAW264.7 cells were labeled for 18 h with tritiated cholesterol in the presence of cAMP to upregulated ABCA1. After removal of labeling media and washing of the cells, medium containing lipid-free acceptor, again in the presence of cAMP unless otherwise noted, was added to the cells for 8 h. The free cholesterol (FC) efflux was calculated as percentage of total cell cholesterol, calculated as the sum of efflux media counts and intracellular counts after the cells were solubilized in isopropanol. A) Cholesterol efflux to lipid free acceptors. B) Dose curve of cholesterol efflux to lipid-free acceptors. Percent efflux is normalized to corresponding dose of WT. Bars represent mean + SE from two independent trials of three replicates. WT apoA-I (•), apoA-I E198K (○), apoA-I L42,44D (▼), and apoA-I L46,47D (▽).

