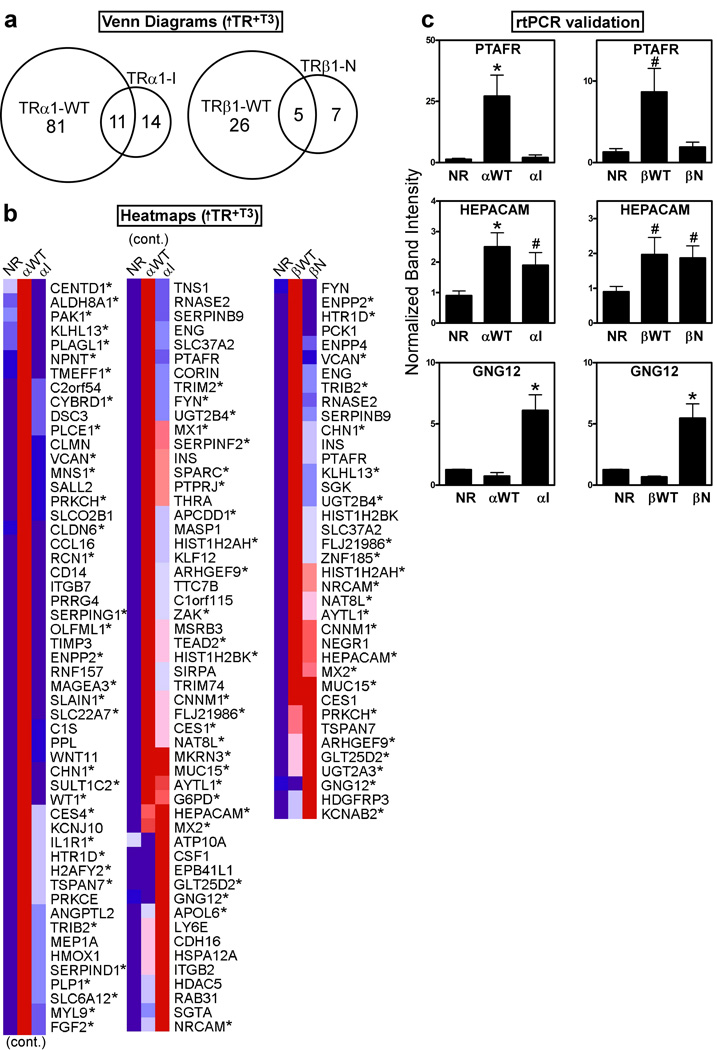
Figure 4. The HCC mutant TRs are able to up-regulate a distinct subset of target genes in the presence of T3.
(a) Venn diagram of gene transcripts up-regulated in each TR transformant compared to the empty vector (NR) control, all in the presence of T3. HepG2 cells transformed with the TR alleles indicated, or with the empty plasmid control, were incubated with T3 for 6 hrs.; RNA was isolated, and used to probe the arrays. Transcripts up-regulated in each TR transformant compared to the empty vector control (NR) were identified using a Benjamini-Hochberg adjusted p-value of <0.05. (b) Heat map clustering of the genes from panel (a). For each gene, dark blue indicates lowest expression, dark red indicates highest expression, with intermediate values represented by lighter shades. These comparisons were plus T3; asterisks indicate genes that were also up-regulated in the absence of T3 (see Figure 7). (c) rtPCR on representative genes identified in panel (b), using gene-specific primers. The level of expression of each gene product was defined as “1” for the empty vector control in the absence of T3 (mean + S.E.M., n = 3). An "*" indicates that the difference between the TR transformant and the empty vector control was significant at a P value ≤ 0.05; "#" indicates a P value ≤ 0.1.

