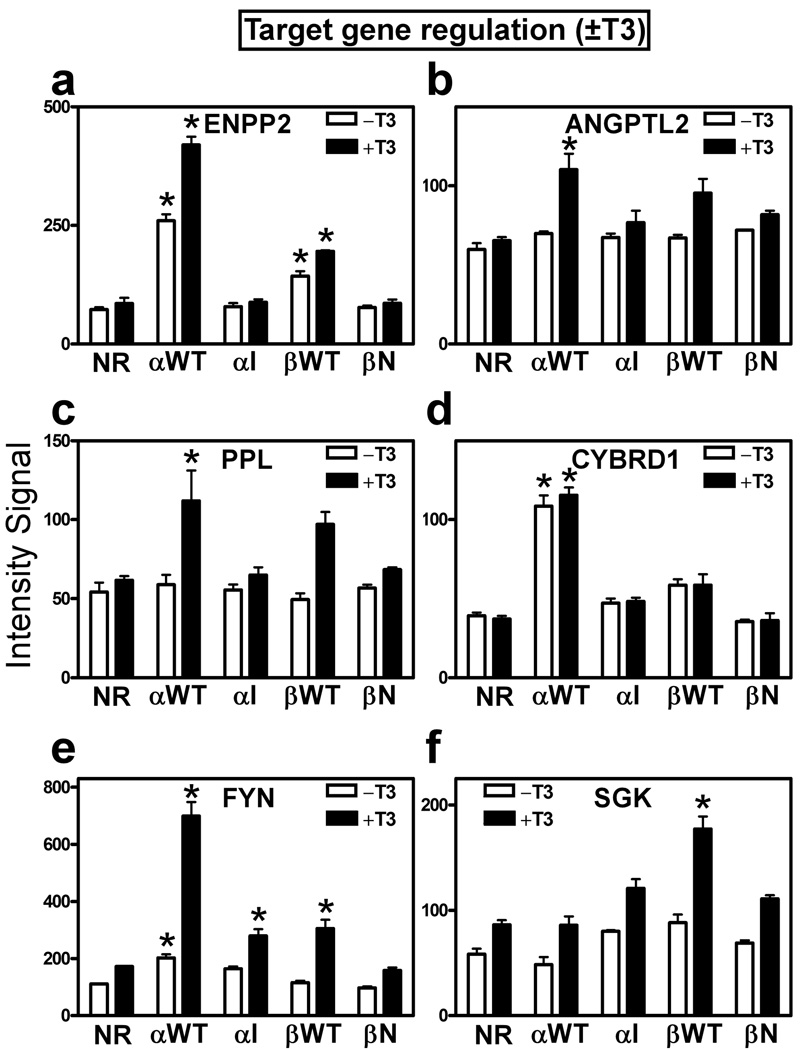
Figure 5. Certain target genes are constitutively up-regulated by TRs independent of hormone status; others are up-regulated only in response to T3.
(a-f) Expression levels, minus or plus T3 treatment, of representative gene transcripts from the panel of genes identified in Figure 4. Microarray intensity signal values are presented (mean + S.D., n = 3) are presented for HepG2 transformants bearing each of the TR expression vectors indicated. An "*" indicates that the difference between the TR transformant and the empty vector control was significant at a P value ≤ 0.05.

