
Figure 1. Association of endogenous PARG and overexpressed PARG with mitochondria.
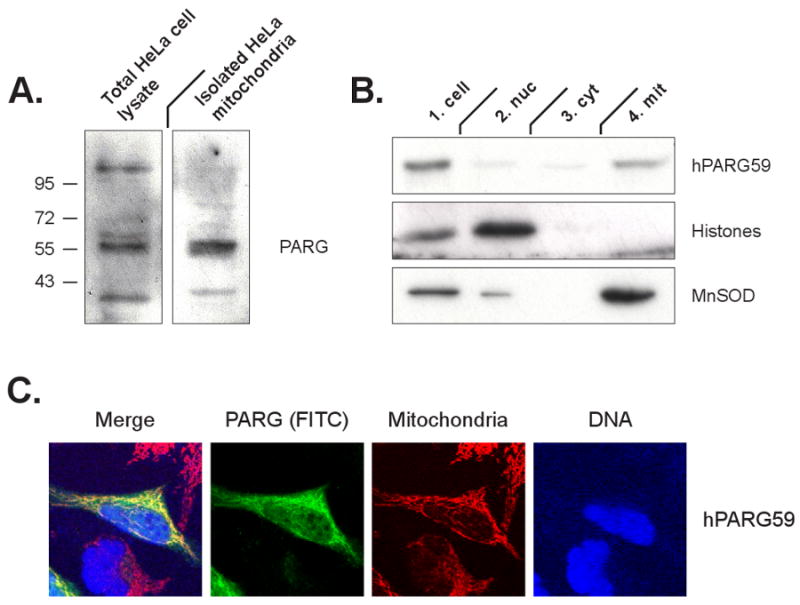
Panel A: Detection of endogenous PARG in total HeLa cell lysates and isolated mitochondria using an antibody recognizing the PARG C-terminus. Panel B: Immunodetection of PARG via the V5 tag following transfection of cells with the hPARG59 expression construct. Immunodetection of histones and MnSOD as indicators of purity of the mitochondrial fraction also is shown. Panel C: Immunodetection of PARG via the V5 tag (green) in whole cells following transfection with hPARG59 and using confocal microscopy. Mitochondrial colocalization was determined using the Mitotracker stain (red) and DNA was visualized with DAPI (blue).