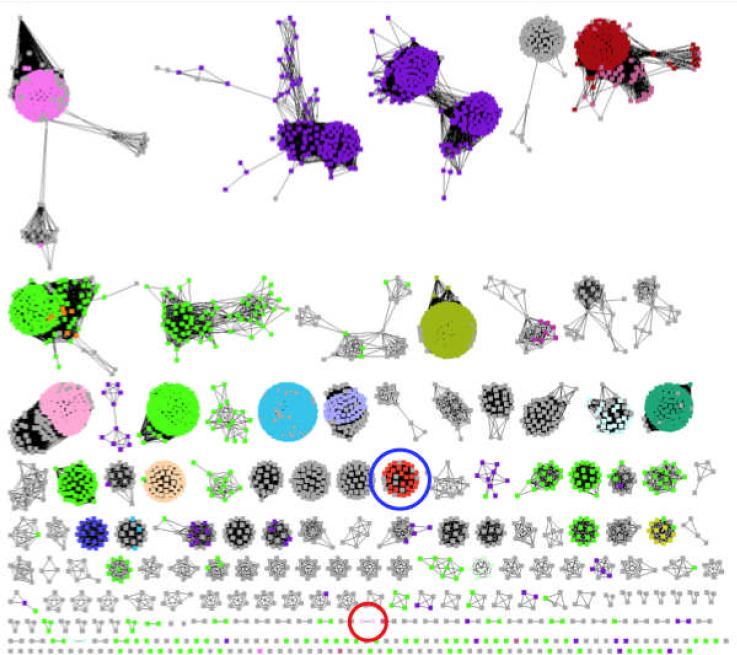
Figure 1.
Sequence similarity network for the enolase superfamily. Sequences are shown schematically as nodes (dots); BLASTP connections with E-values ≤ 10−80 are shown as edges (lines). At this E-value (sequence identities > ~35%), most of the resulting clusters of sequences are expected to be isofunctional families. Sequences that have unknown functions are colored grey. The cluster that contains Ob2843 is circled in red; the cluster that contains TalrD/GalrD is circled in blue.

