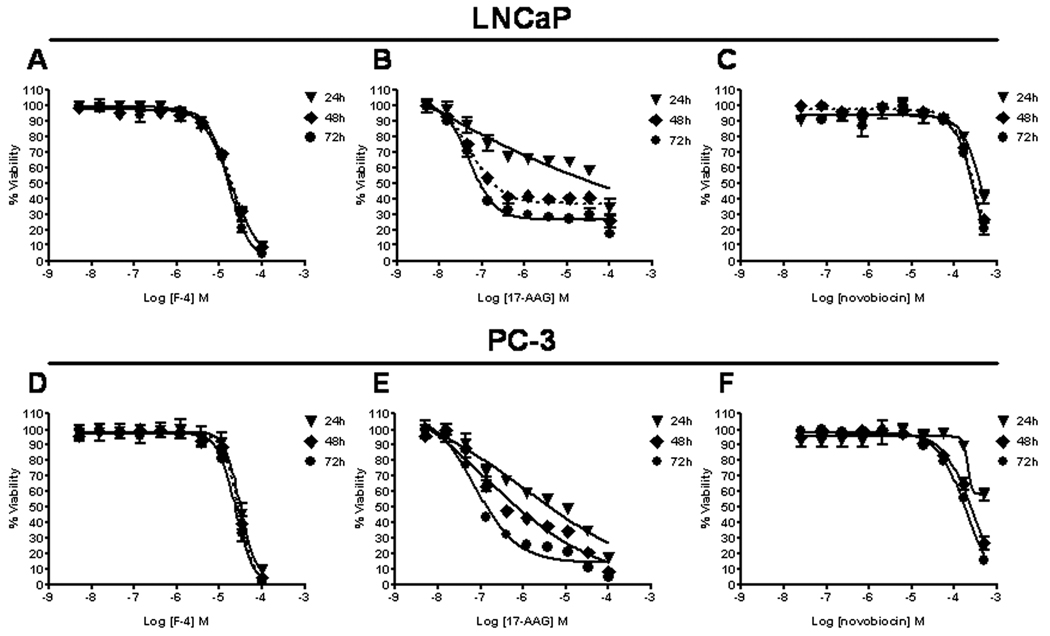
Figure One. Anti-proliferative effects of F-4 in prostate cancer cell lines.
LNCaP (top panels A–C) and PC-3 cells (bottom panels D–F) were treated with F-4, 17-AAG, or novobiocin for 24(▼), 48(♦) and 72(●) hours. Bioreduction of tetrazolium (MTS) dye to a formazan by-product was used to measure cellular proliferation. Combined normalized data from independent experiments is shown for cells treated with F-4 (panels A and D), 17-AAG (panels B and E), and novobiocin (panels C and F). Data was analyzed from 2–4 independent experiments performed in duplicate; each data point represents the mean ± SEM.

