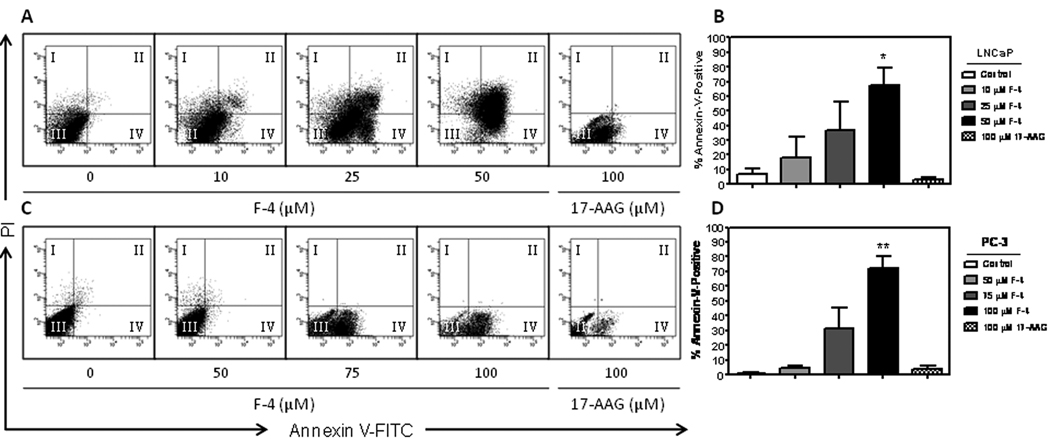
Figure Five. F-4 manifests induction of apoptosis in prostate cancer cells.
LNCaP and PC-3 cells were treated with F-4 or 17-AAG for 72h. Representative flow cytometry scatterplots depict percent Annexin V staining for LNCaP (panel A) and PC-3 cells (panel C) after F-4 and 17-AAG treatment. The four quadrants of the scatterplot represent the percent of the parent population and indicate the following: I. PI- staining only indicating necrosis; II. Annexin V and PI staining depicting late-stage apoptosis; III. Negative staining indicating live cells; IV. Annexin V staining alone indicating early-stage apoptosis. A bar graph depicting the total percent apoptosis (Annexin V positive cells in quadrants II + IV) following treatment with statistical analysis is shown for LNCaP and PC-3 cells (panels B and D, respectively). Asterisk(s) *, ** indicates significant P value <0.05, and <0.01, respectively, by two-tailed t-test compared to vehicle-treated control.

