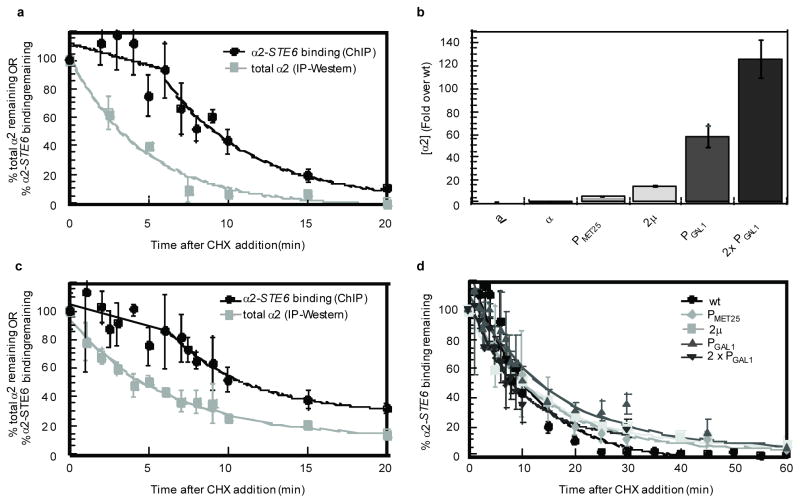
Figure 1. Increased expression of α2 does not affect its dissociation from DNA.
a, Dissociation of α2 from its DNA-binding site in the STE6 promoter compared to α2 degradation kinetics in wild-type cells, after the addition of cycloheximide (CHX). b, Relative levels of steady-state α2 expression in cells where α2 is expressed from a multi-copy vector (2μ) or from several different promoters. Cells containing two copies of a PGAL1-α2 construct are denoted 2 × PGAL1. c, The dissociation of α2 from its DNA-binding site in the STE6 promoter compared to the degradation kinetics of the α2 protein after the addition of CHX to cells over-expressing α2 from the GAL1 promoter. Note the similarity to a, despite the over-expression of α2. d, Dissociation of α2 from its STE6 DNA-binding site after addition of CHX to cells expressing varying amounts of α2. The time-course was expanded and the data from all of the different over-expression conditions is plotted together to highlight the observation that no increase in the DNA-binding lag time was apparent in cells expressing increased amounts of α2, which is in contrast to the specific prediction of a model in which α2 is depleted below its dissociation constant. The data for wild-type and PGAL1-α2 cells from a and c respectively are included for comparison. Note that the DNA-binding lag time is not apparent in d because a number of these experiments did not sample multiple times during the first five minutes of the time-course. For this reason and for simplicity, all of the dissociation curves in d were fit to an exponential decay. For easier visualization of the individual trends, the data in d is split into two parts and plotted again in Supplemental Fig. S1. Error bars represent s.e.m., n =2–8; min= minutes.

