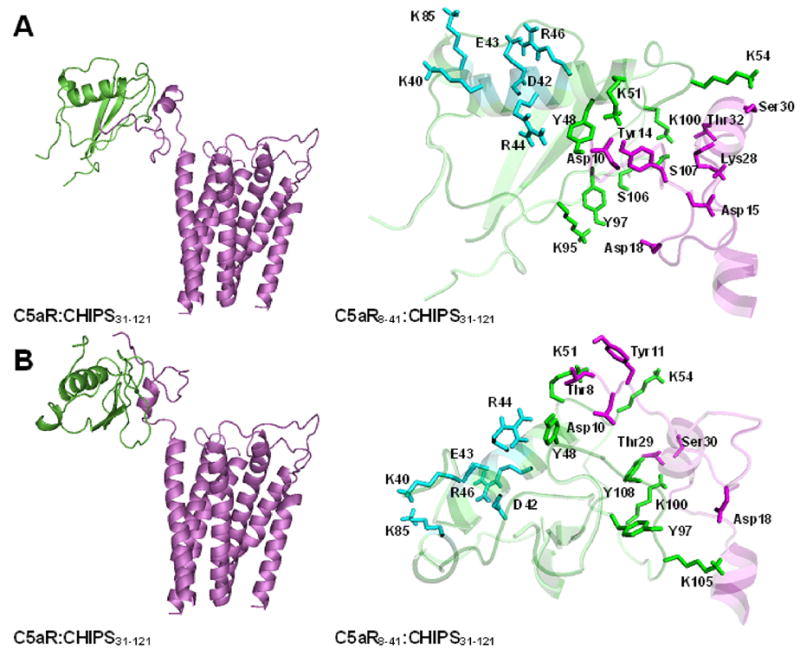
Fig. 1.

Right panels show cartoon sketches of complexes of CHIPS31-121 (green) and C5a (magenta). Left panels show more detailed sketches of complexes CHIPS31-121:C5aR8-41 focusing on possible strong residue-residue interactions. Side chains are shown as sticks and labeled by one letter notation (CHIPS residues) or by three-letter notation (C5aR residues). Residues K40 – R46 are shown in cyan, interface residues Y48 – Y108 are in green, Asp10 – Ser30 are in magenta. A and B relate to the first and second suggested models, respectively.
