
Figure 1.
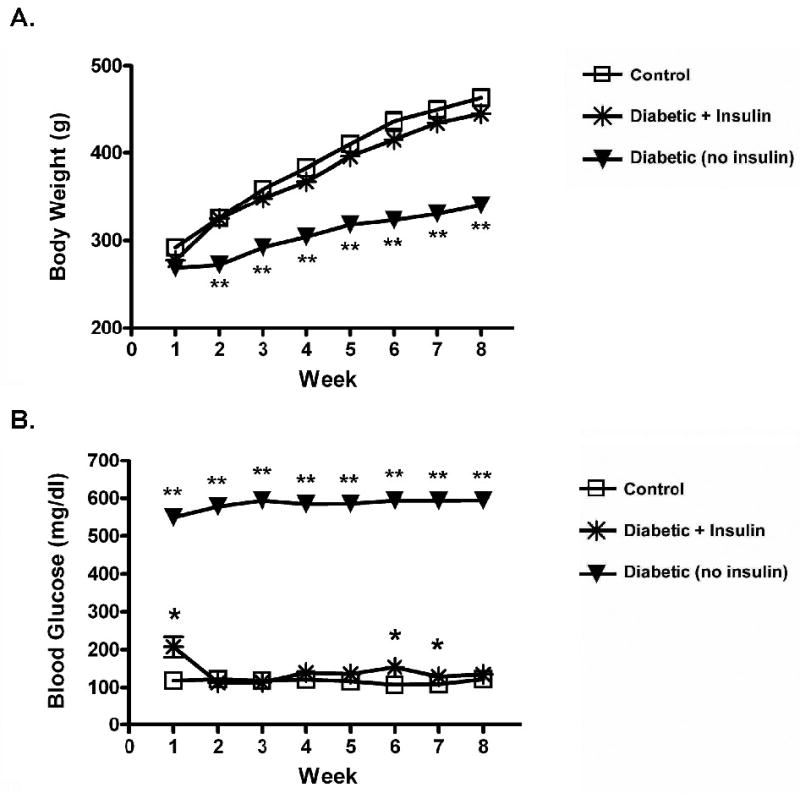
Insulin effects on alterations in body weight (A) and blood glucose (B) for 8 weeks of diabetes. Values represent means ± SEM. Statistical significance is as follows: * p < 0.01 from Control; ** p < 0.001 from Control and Diabetic + Insulin. (Control: n = 24; Diabetic + Insulin: n = 24; Diabetic/no insulin: n = 24). Similar results were seen in animals in the 4 week diabetes group.