
Figure 2.
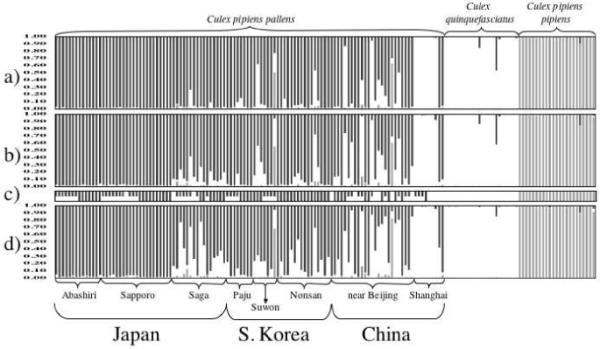
Comparison of the results of multilocus genotype analyses of Japanese, ROKn, and Chinese populations of mosquitoes in the Culex pipiens complex using (a) 7, (b) 6, and (d) 5 microsatellite loci. Each of the individuals is represented by a column partitioned into three shaded segments that represent the individual’s probability of ancestry from one of three genetic clusters (dark grey, Culex pipiens pallens, white, Cx. quinquefasciatus, light grey, Cx. p. pipiens form molestus). For this representation individuals were grouped by location (bracketed). Populations of Cx. p. pallens are ordered from North to South within each country. (c) Summary of the individual ACE rapid assays. The diagnostic bands are represented by a bar of a single shade or, in the case of hybrids, by a bar divided into two shades (the shades are the same as in the multilocus genotype analyses).