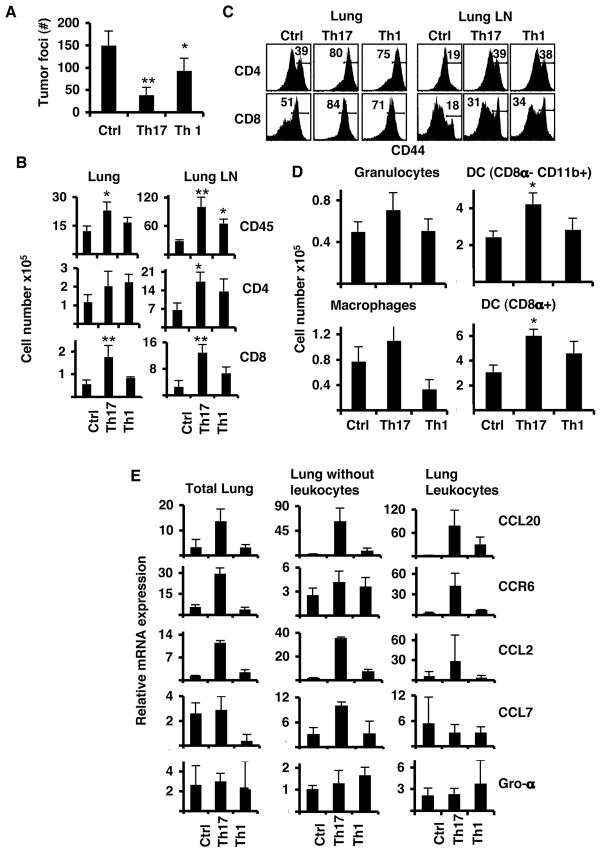
Figure 3. Anti-tumor Th17 cells control established B16/F10 melanoma.
A. Mice were inoculated i.v. with B16-OVA and on day 5, these mice received 3×10⁶ Th1 or Th17 cells i.v. Mice were euthanized on day 14 after tumor challenge for analysis. Shown are the tumor colonies present in the lung lobes of each group of mice (n=4, avg. +/− s.d). B. Cell numbers from leukocyte lung fractions of each group of mice, Control (Ctr), Th1 and Th17, were calculated from the percentages of live cells gated on CD45.2 (n=4, avg. +/− s.d). C. Expression of CD44 on T cells obtained from the lung leukocyte fraction (Lung) or from lung lymph nodes (Lung LN). Cells were gated on CD45.2 and CD4 (middle panel) or CD8 (lower panel). Numbers represent the percentages of CD44hi cells. D. Total numbers of myeloid cell populations from leukocyte lung fraction. Numbers of cells were calculated from the percentages of live cells gated on CD45.2 (n=4, avg. +/− s.d.). E. Gene expression analysis of total lung derived cells with leukocytes and leukocyte fractions. Graphs represent the average values of four mice after duplicate analysis per sample (n=4, avg. +/− s.d). Results shown are from one representative experiment of three using 4–5 mice per group. (* = p< 0.05, ** = p< 0.01).

