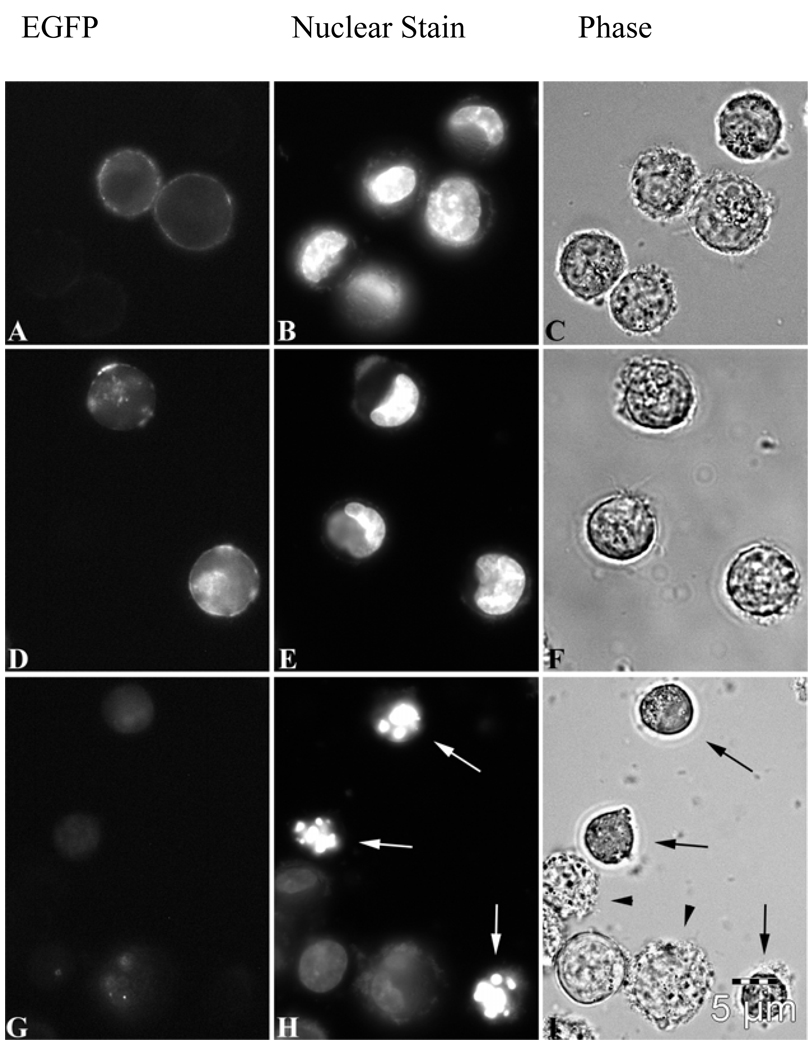
Figure 2.
A–C. EGFP-Bcr-Abl transfected into K562 cells; fluorescent (EGFP), nuclear staining with H33342, and phase contrast images, respectively. D–F. EGFP-1NLS-Bcr-Abl transfected into K562 cells; fluorescent (EGFP), nuclear staining with H33342, and phase contrast images, respectively. G–H. EGFP-4NLS-Bcr-Abl transfected into K562 cells; fluorescent (EGFP), nuclear staining with H33342, and phase contrast images, respectively. White arrows (H) indicate apoptotic cells undergoing massive DNA segmentation. Black arrows (I) indicate that these same cells have undergone cell shrinkage, a morphological hallmark of apoptosis[20–24]. Black arrowheads (I) show cells undergoing zeotic/cytoplasmic blebbing. Scale bar (5µm) representative for all panels (A–I).

