
Fig 2.
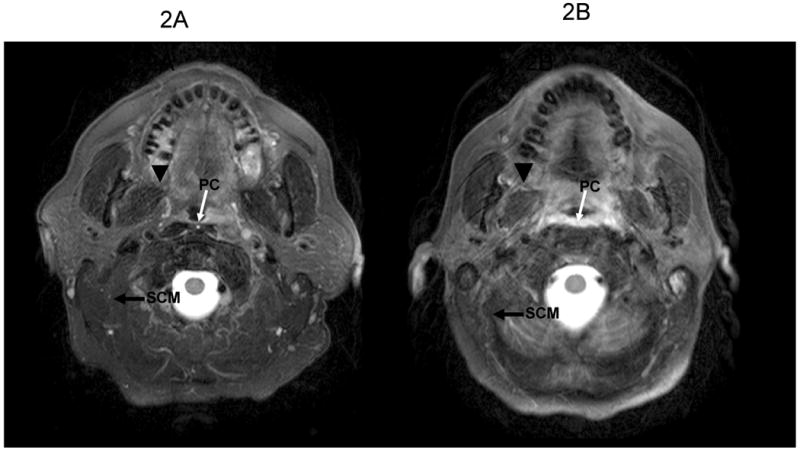
An MRI cut of a T2-weighted image. 1A: pre-RT. 1B: 3 months post-RT. Note the increase of the width and signal of the pharyngeal constrictor (PC) compared to the mild differences in T2 signal and slightly reduced widths of the ipsilateral sternocleidomastoid (SCM) and pterygoid (arrowhead) muscles, which received high doses.