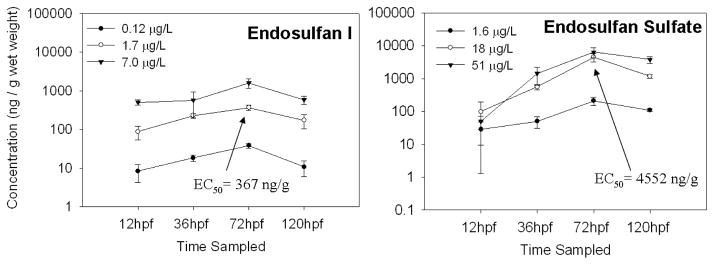
Fig. 2.
The average concentration (ng/g) in zebrafish embryos and larvae sampled over the course of a 5 day exposure to endosulfan I and endosulfan sulfate. Endosulfans were not detected in control fish or water. The bars represent the standard deviation; n = 3. The tissue EC50 for abnormal touch response is shown.

