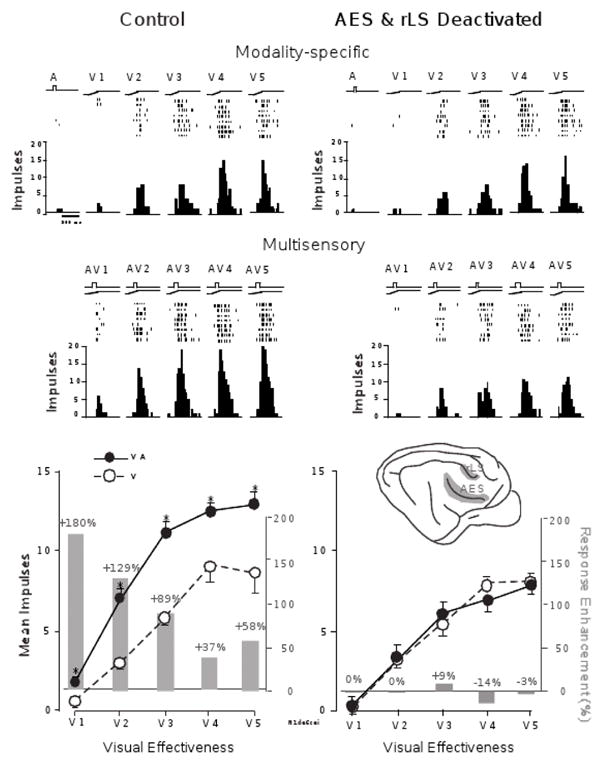
Figure 5.

Multisensory integration in the SC depends on association cortex. SC responses to auditory (A), visual (V), and multisensory (AV) stimuli are recorded before (left) and after (right) the deactivation of association cortex. The visual stimulus is tested at multiple (5) levels of effectiveness. The graphs at the top of the figure provide stimulus traces, impulse rasters, and peri-stimulus time histograms for each response. The bottom graphs provide summaries of the mean response levels (lines) and the percent multisensory enhancement (bars) observed for each of the stimulus pairings. Prior to the deactivation of cortex, the responses evidence the characteristic “inverse effectiveness,” with larger unisensory responses associated with smaller multisensory enhancements. However, after cortical deactivation (shaded region of inset), multisensory enhancements are significantly attenuated and even eliminated at each of the stimulus effectiveness levels tested. From Jiang, et al., 2001.
