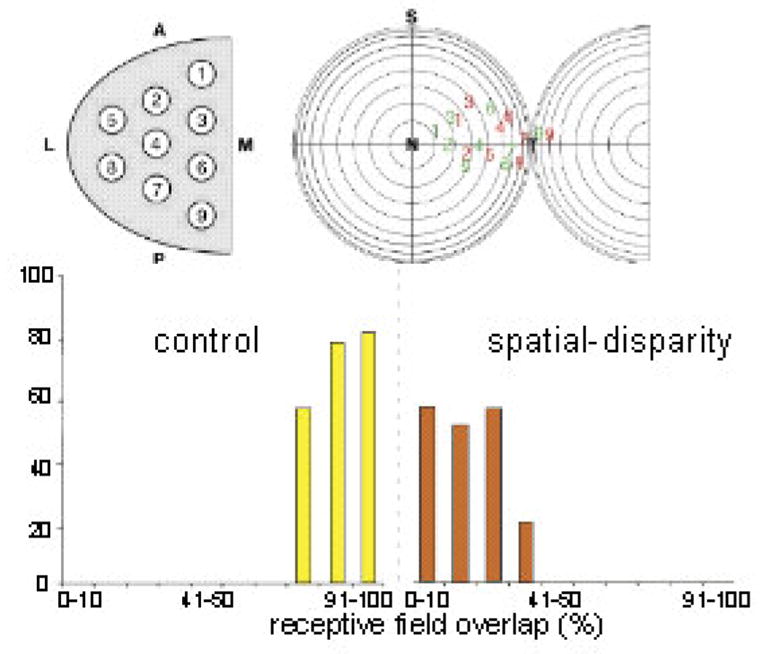
Figure 8.

SC sampling and RF overlap in normal and V-A spatial disparity reared animals. Top: Normal sampling of all SC quadrants yielded visual (red) and auditory (green) receptive field (RF) center distributions. Bottom: % RF overlap in control animals (yellow) was often 91–100%; far exceeding that seen in spatial-disparity reared animals (red, often <10%). The physiology of a characteristic neuron is shown in Figure 9. Adapted from Wallace and Stein 2007.
