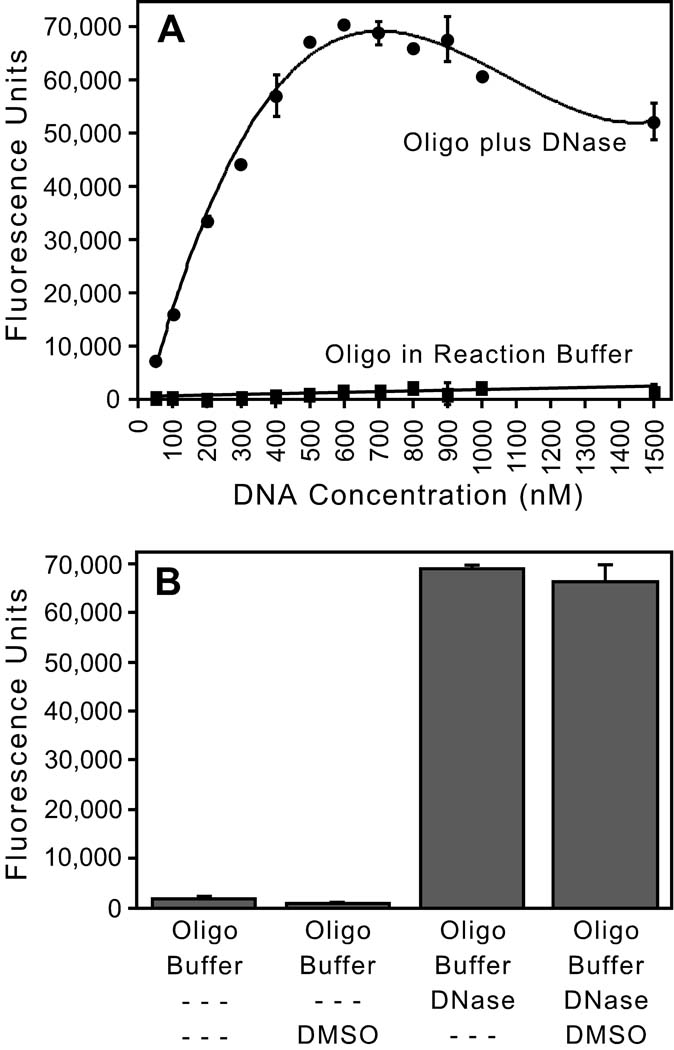
FIG. 3. Validation of the fluorescence-based assay.
(A) Effect of DNA concentration. Increasing concentrations of the F/Q-tagged oligonucleotide depicted in Fig. 2 were incubated in integrase reaction buffer or in the same buffer plus 50 µg DNase I, and reactions were conducted and analyzed as in Table 1 (except the cooling temperature in this early experiment was 63°C). The means ± SD of duplicate reactions are shown. (B) Effect of DMSO. 500 nM of the F/Q-tagged 49-mer was incubated in reaction buffer without or with 20% DMSO (the first 2 bars, respectively) or in reaction buffer plus 1 µg DNase I without or with 20% DMSO (the last 2 bars, respectively), and analyzed as in Table 1; the means ± SD of quadruplicate reactions are shown. Figs. A and B are representative of at least two experiments for each condition.

