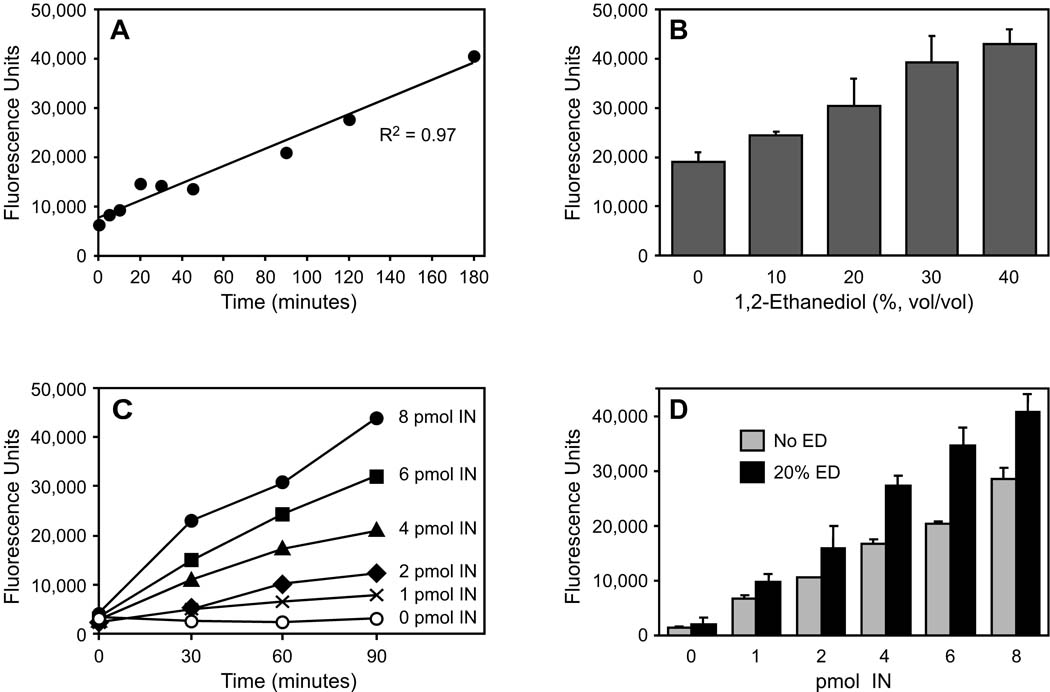
FIG. 4. Parameters of the fluorescence assay.
Except as noted, all reactions were conducted and analyzed as in Materials and methods. (A) Time course of integrase-mediated nicking. 500 nM of the F/Q-tagged 49-mer was incubated with 4 pmol HIV-1 integrase and 20% ED in replicate microcentrifuge tubes, and at various times individual reactions were heated at 65°C to inactivate integrase and then transferred to a 384-well plate for analysis. (B) Dose-dependant stimulation by 1,2-ethanediol. 500 nM of the F/Q-tagged 49-mer was incubated for 90 minutes with 4 pmol HIV-1 integrase and the indicated concentrations of ED; the means ± SD of triplicate reactions are shown (R2 = 0.99 for the regression line, not shown). (C) Effect of integrase concentration. 500 nM of the F/Q-tagged 49-mer was incubated with increasing amounts of HIV-1 integrase in the presence of 20% ED in microcentrifuge tubes, and at various times aliquots were removed, heated at 65°C, then transferred to a 384-well plate for analysis. (D) Stimulation of varying integrase concentrations by ED. 500 nM of the F/Q-tagged 49-mer was incubated for 90 minutes with increasing amounts of HIV-1 integrase with or without 20% ED present; the means ± SD of triplicate reactions are shown (R2 = 0.98 for each regression line, not shown; the p-values comparing the bars were 0.04 for 1 pmol integrase, 0.08 for 2 pmol integrase, < 0.002 for 4 or 6 pmol integrase, and < 0.006 for 8 pmol integrase). The number of pmols indicated in Figs. C and D is per 10-ul reaction.

