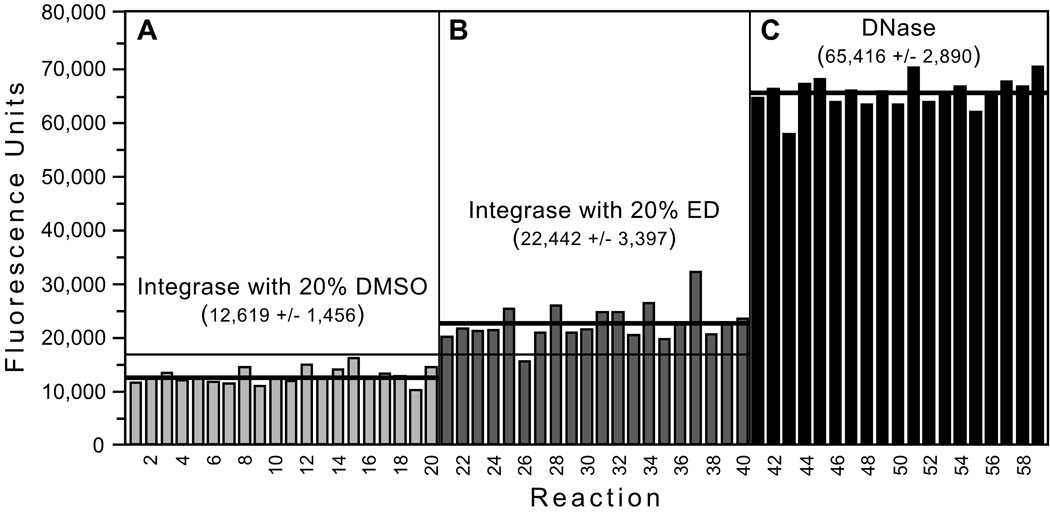
FIG. 5. Performance of the assay.
Using the optimized conditions, 3 sets of 20 reactions were set up with: (A) 4 pmol integrase plus 20% DMSO as negative controls for baseline nicking, (B) 4 pmol integrase plus 20% ED as an example of a known integrase stimulator, and (C) 10 µg of DNase I as positive controls for maximum nicking (one reaction from the third set is not shown and was excluded from analysis because it had minimal fluorescence and apparently did not receive DNase). Reactions were conducted and analyzed as in Table 1. The mean ± SD is shown for each set of reactions, thick lines are drawn at each mean value, and the thin horizontal line indicates the mean + 3 SD for the negative controls.

