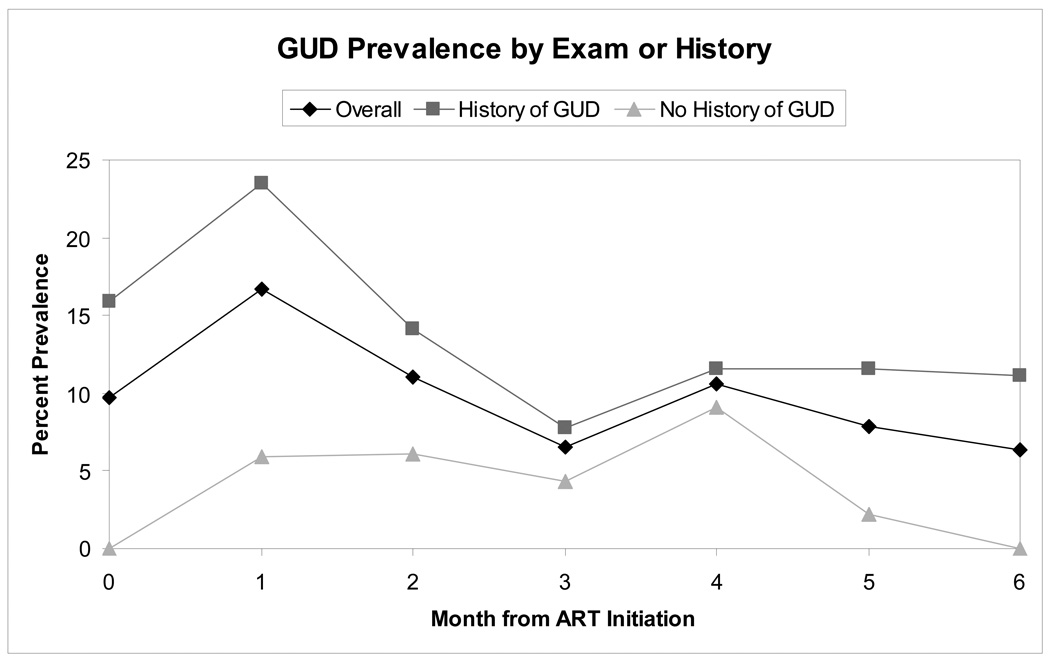
Figure 1. GUD Prevalence by Month from ART Initiation.
The figure depicts the prevalence of GUD diagnosed by examination or patient report at monthly follow-up visits among women initiating ART. The black line with diamonds indicates prevalence in the entire population of 134 women, the heavy grey line with squares the prevalence in the 82 women with a history of GUD prior to ART initiation, and the light grey line with triangles the prevalence in the 52 women with no history of GUD prior to ART initiation.

