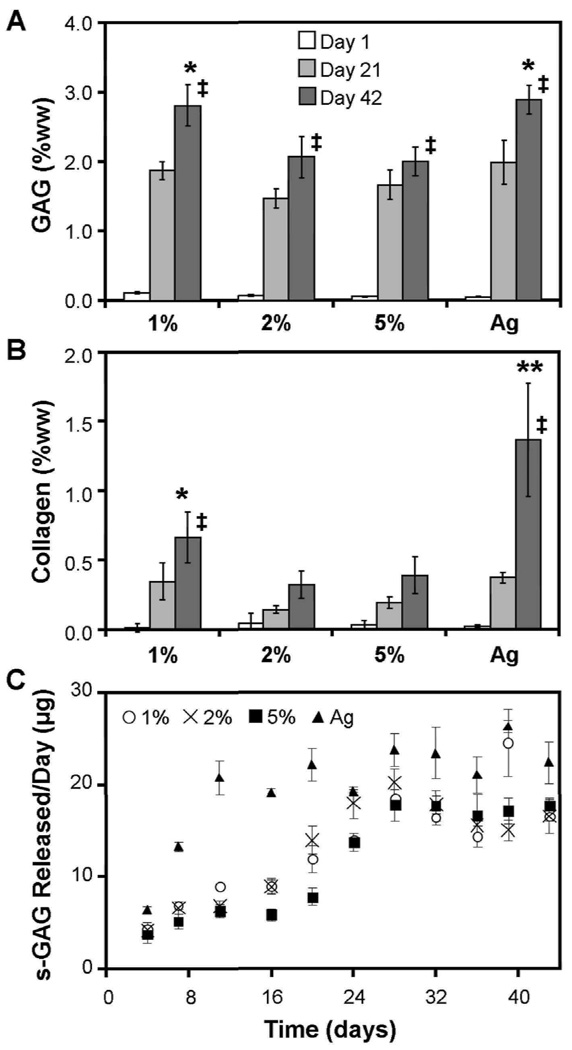
Figure 5.
A) s-GAG percent wet weight (% ww) in 1, 2, and 5% MeHA, and Ag constructs through 42 days of in vitro chondrogenic culture. (* indicates p<0.05 vs 2% and 5% MeHA at day 42) B) Collagen content (% ww) in MeHA and Ag constructs through 42 days of culture. (** indicates p<0.05 vs all other groups at day 42, * indicates p<0.05 vs. 2% MeHA) Increased concentration of ECM was observed in Ag and 1% MeHA hydrogels by day 42. (n=4/group/time point, ‡ p<0.05 vs. day 0) C) s-GAG release per day per construct for MSC-seeded MeHA and Ag constructs through 42 days of culture.

