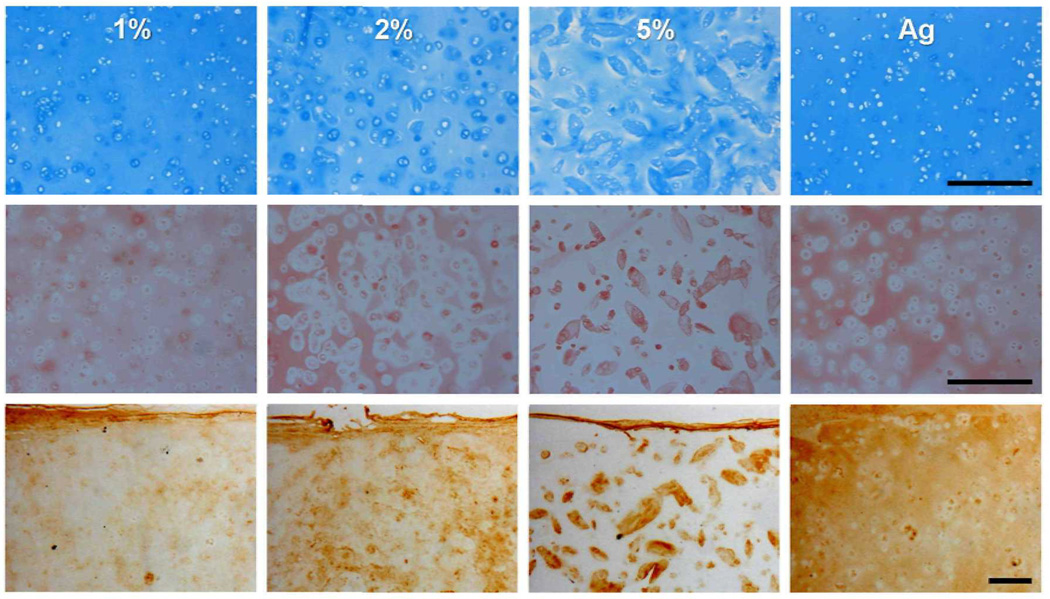
Figure 8.
Alcian blue (top) and Picrosirius red (middle) stained sections from 1, 2, and 5% MeHA and Ag constructs (10X magnification) on day 42. Collagen type II immunostaining (bottom) on day 42 (5X). Note the dependence of PG and collagen distribution on MeHA macromer concentration. (Scale bar = 250 µm)

