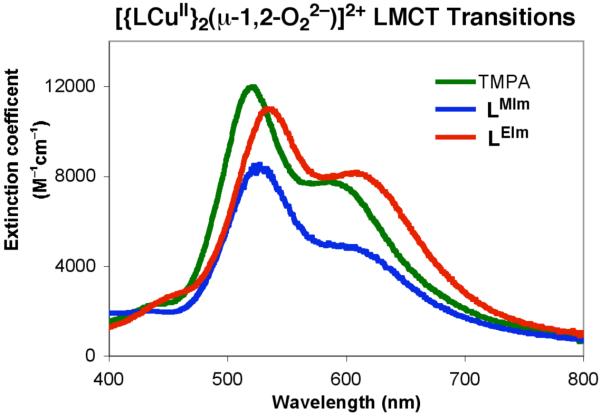
Figure 5.
UV-Visible spectra of μ-1,2-peroxo intermediates from LCuI complexes (L = TMPA, LMIm, and LEIm) reacting with dioxygen at reduced temperature. The ε value scale for the LMIm peroxo complex spectrum shown here is not to scale (εapparent values are much lower, see text), but shown here in order to easily compare λmax values.

