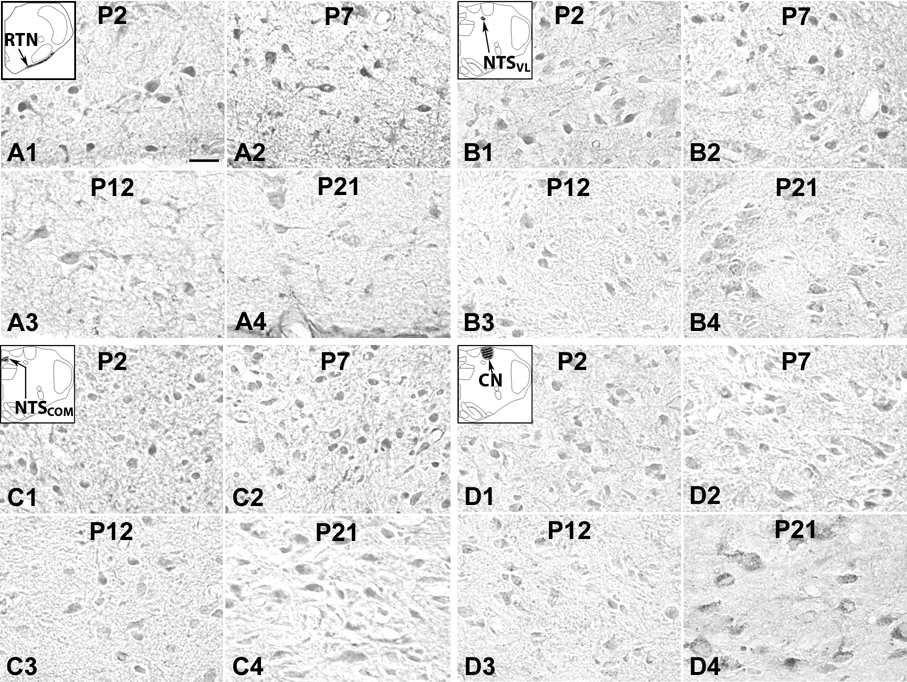
Fig. 6.
5-HT1BR-ir neurons in the RTN/pFRG (A; labeled as RTN in the inset), NTSVL (B), NTSCOM (C), and CN (D) at P2 (A1–D1), P7 (A2–D2), P12 (A3–D3), and P21 (A4–D4). The labeling in the RTN/pFRG exhibited a relatively high level from P2 (A1) through P7 (A2) to P10, then gradually fell from P10 through P12 (A3) to P13, followed by a plateau at a relatively low level until P21 (A4). The labeling in the NTSVL, NTSCOM, and CN was relatively constant from P2 to P21 (B1–B4, C1–C4, and D1–D4). Scale bar: 20 µm for all.

