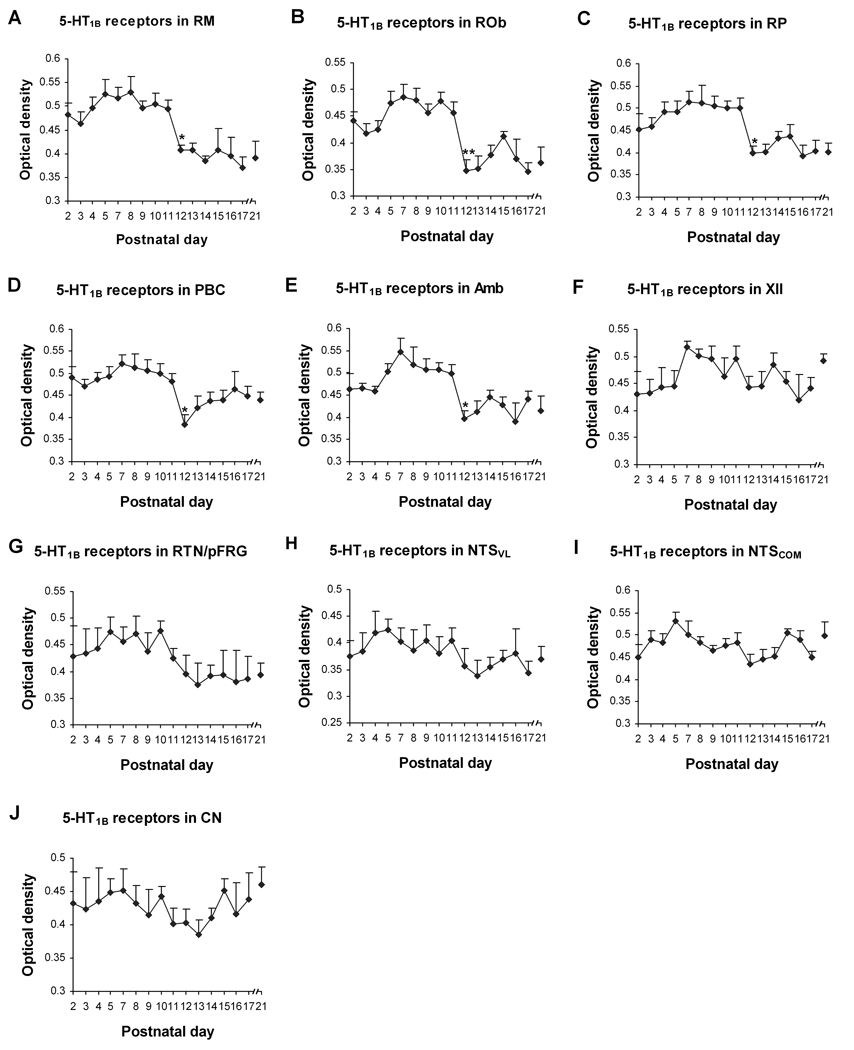
Fig. 7.
Optical densitometric measurements of immunoreactive product for 5-HT1BR in the cytoplasm of individual neurons in the RM (A), ROb (B), RP (C), PBC (D), Amb (E), XII (F), RTN/pFRG (G), NTSVL (H) , NTSCOM (I), and CN (J) from P2 to P21. Data points were presented as mean ± SEM. The labeling in the first five nuclear groups (A–E) followed pattern I trend of development, with a significant decrease at P12 (P < 0.05). The trend for the RTN/pFRG (G) was that of pattern II, whereas those for XII (F), NTSVL (H), NTSCOM (I), and CN (J) were of pattern IV (see text for details). ANOVA revealed significant differences in 5-HT1BR expression among ages in the RM, ROb, RP, PBC, and Amb (P < 0.01). Tukey’s Studentized test showed a significant reduction in the RM, ROb, RP, PBC, and Amb at P12, compared with their adjacent younger age groups (P11). *, P < 0.05 (Tukey’s Studentized test).

