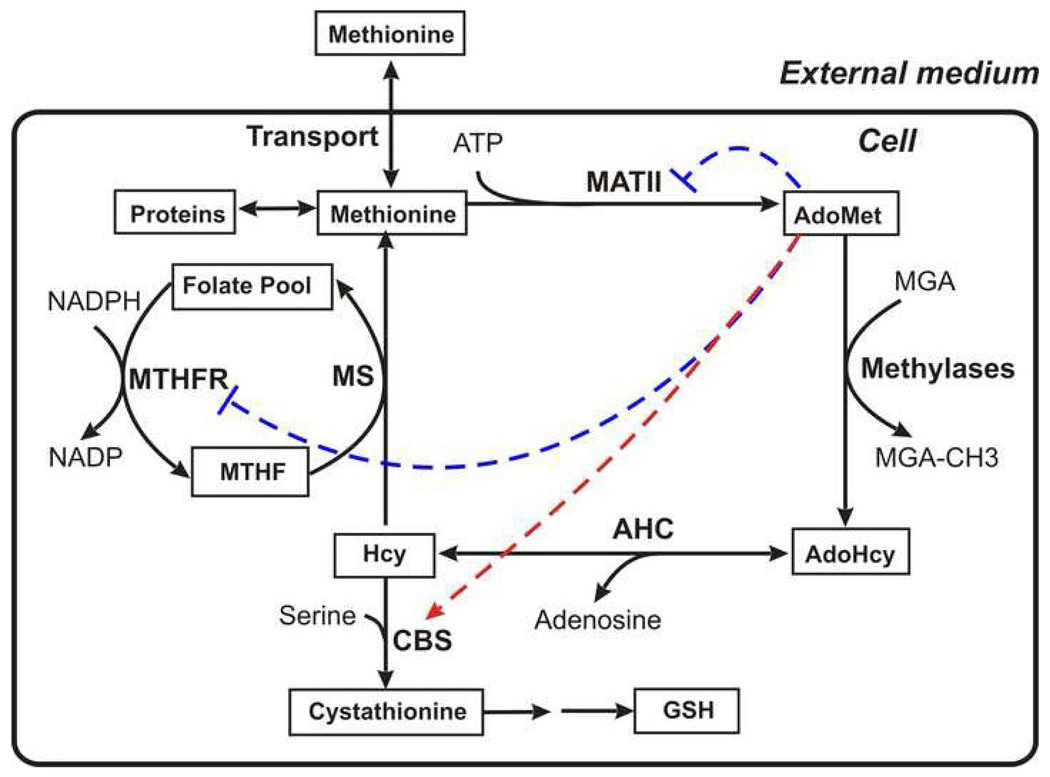
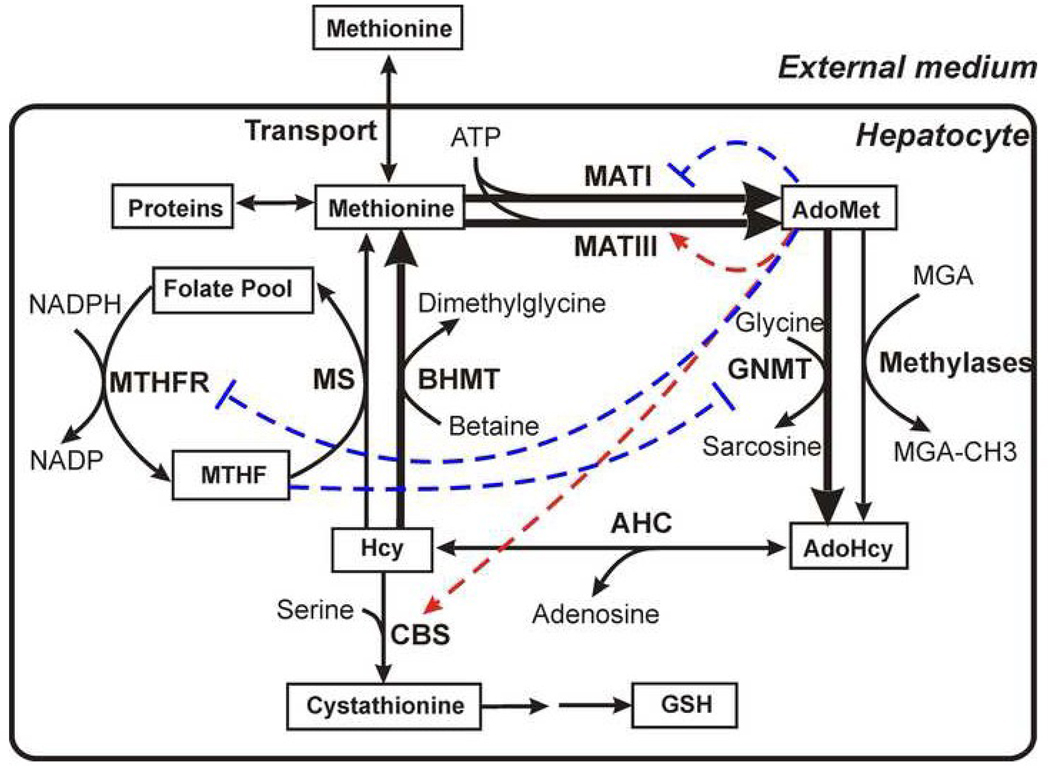
Fig. 1.
General scheme depicting methionine metabolism (A) in most extrahepetic tissues and (B) in hepatocytes. The solid arrows depict enzymatic reactions and the thick lines denote hepatocyte-specific enzymes. The dashed red arrows and the dashed blue lines indicate respectively allosteric activation and inhibition of enzymes by metabolites. The abbreviations used in this figure are described1. The figure is based on Fig. 1 from [36].


