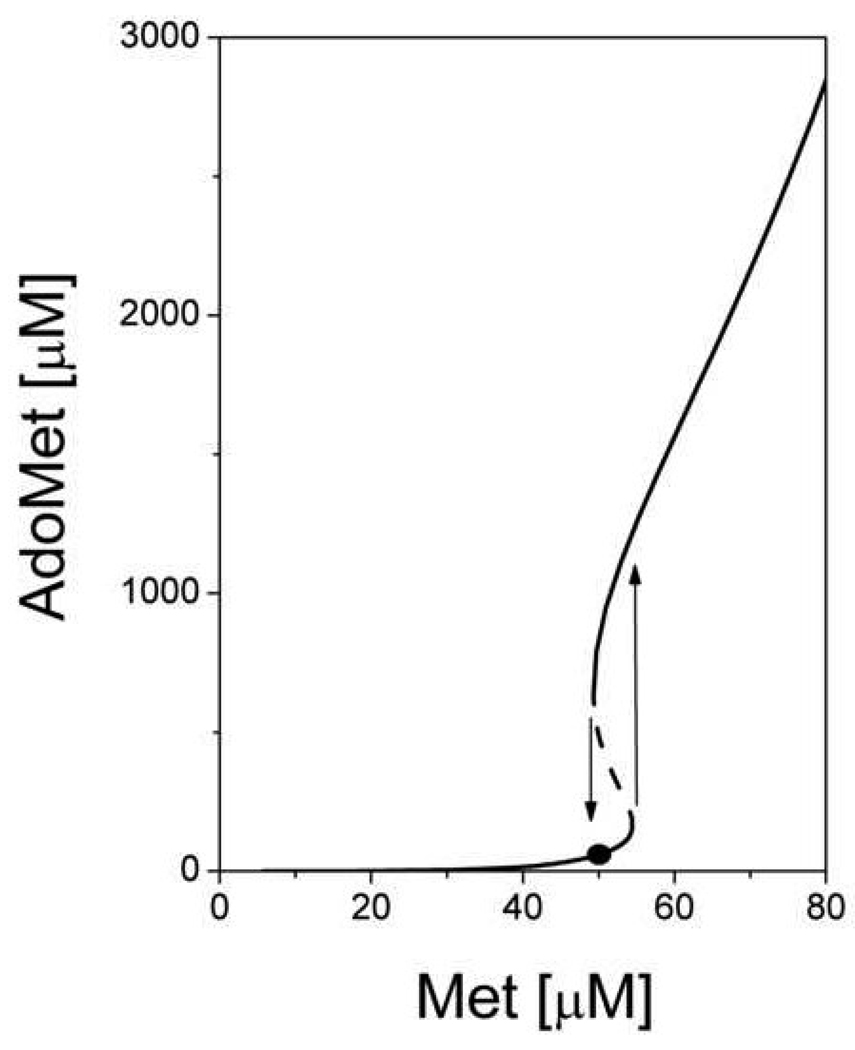
Fig. 4.
Steady-state concentration of AdoMet as a function of methionine concentration obtained using the model of Martinov et al., 2000 [21]. The dashed line indicates unstable steady states. Arrows indicate jumps in the AdoMet concentration at threshold methionine concentrations. The solid circle indicates the physiological steady state in the “low” mode. This figure is reproduced from [21] (Fig. 6) with permission obtained from the publisher and the authors.

