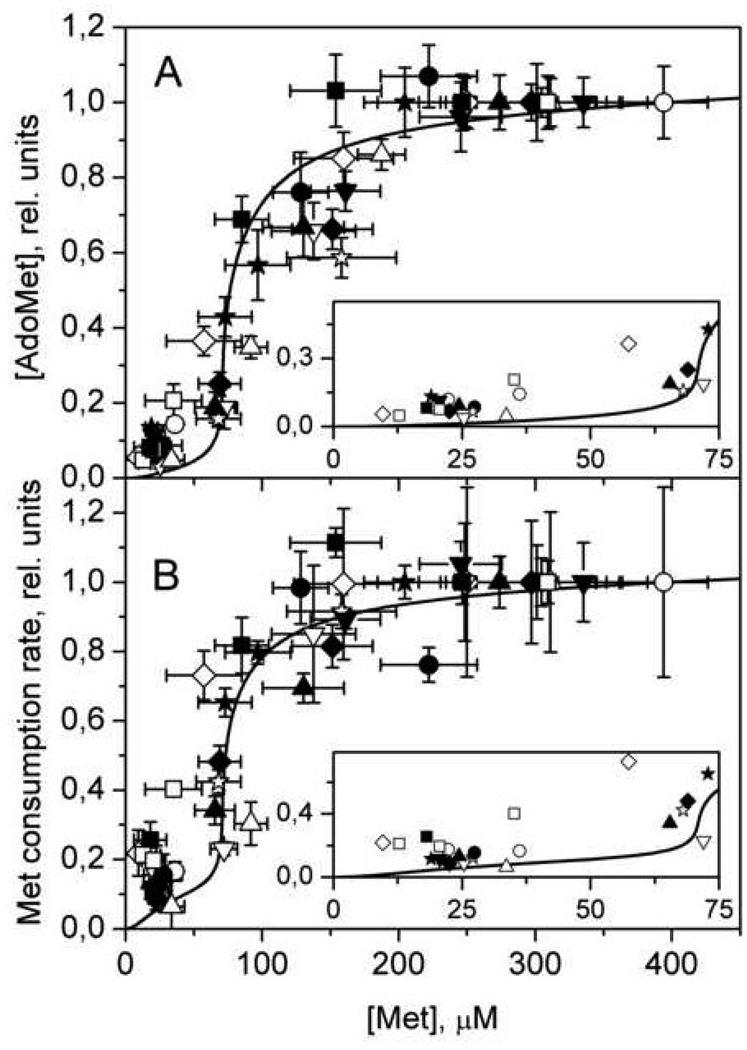
Fig. 8.
The dependence of steady-state values of (A) AdoMet concentration and (B) the rate of methionine consumption on methionine concentration in murine hepatocytes. Symbols indicate experimental data obtained from 12 independent experiments, with each symbol representing a single experiment. Solid lines show the results of mathematical modeling. In each experiment, values for [AdoMet] and methionine consumption rate were normalized to values obtained at initial methionine concentration of 400 µM. The theoretical curves were normalized to values obtained at 400 µM methionine. The insets in both (A) and (B) show the experimental (symbols) and simulated (line) data in greater detail at low methionine concentrations. Error bars were removed in insets for clarity. This figure is reproduced from [36] (Fig. 3) with permission obtained from the publisher and the authors .

