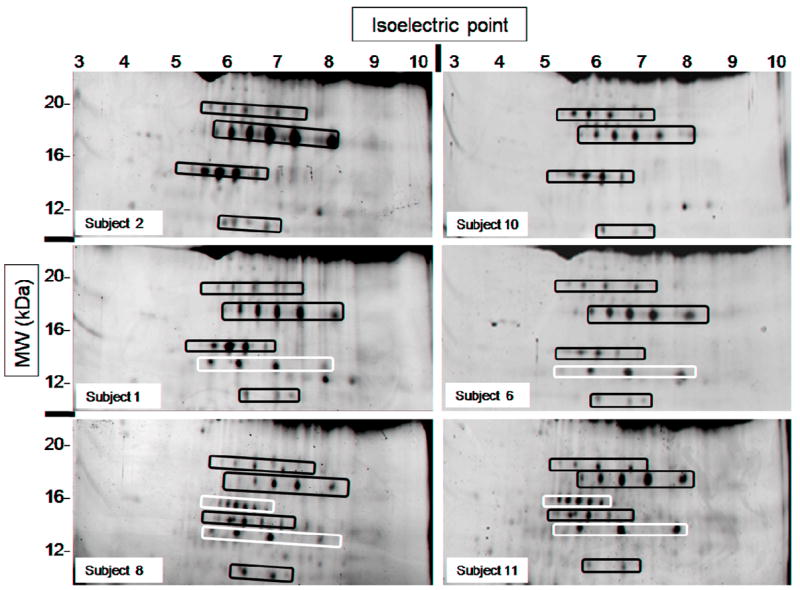
Fig. 1.

Low molecular weight (~10-25 kDa) portion of six gels showing marked heterogeneity in their spot patterns. All images belong to different subjects (see labels) and correspond to the pre-treatment state; these patterns were consistent for each subject before and after treatment. Spot “trains” marked in black were present in samples from all subjects. Spot “trains” marked in white were present in only some of the subjects studied.
