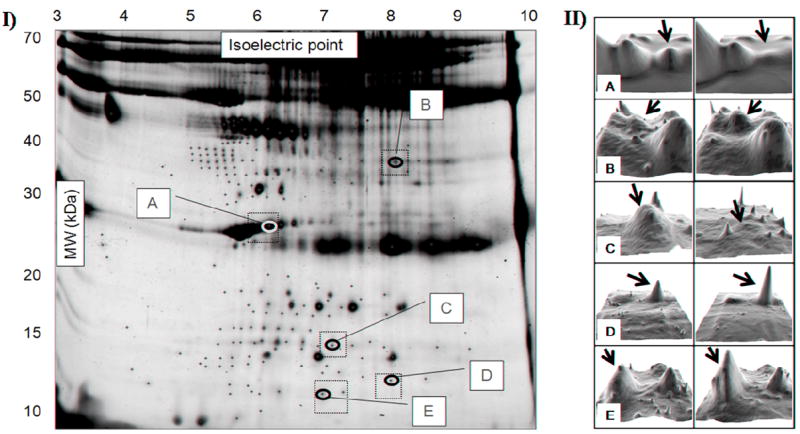
Fig. 2.

I. Representative two-dimensional serum gel. A total of 192 spots were analyzed (plus signs), with 97 being present in all 11 subjects. Five of those displayed significant changes in intensity one week after CJC-1295 administration (labeled A to E). (Dotted squares outline the gel areas that are shown in II). II. Representative 3D images of spots A to E showing changes in intensity before (left) and after (right) treatment. Images were obtained using the 3D Viewer tool from PDQuest, which converts spot intensity data to topographical peaks and valleys. For each spot, left and right images belong to the same subject.
