
Figure 4.
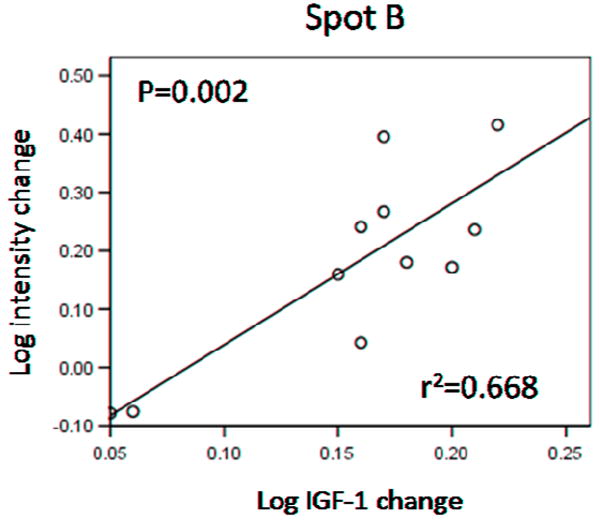
Log intensity changes in spot B displayed a linear correlation with log changes in IGF-1 levels. R2 and P values for the curve are shown on the graph.
Official websites use .gov
A
.gov website belongs to an official
government organization in the United States.
Secure .gov websites use HTTPS
A lock (
) or https:// means you've safely
connected to the .gov website. Share sensitive
information only on official, secure websites.
Log intensity changes in spot B displayed a linear correlation with log changes in IGF-1 levels. R2 and P values for the curve are shown on the graph.